User experience is crucial in any application. Achieving visibility into what works and what doesn't often requires significant time and talent, especially for cloud-native apps. That's why we're excited to announce that OutSystems Developer Cloud now offers end-to-end comprehensive web app monitoring and troubleshooting capabilities with automatic instrumentation of client-side elements.
We've enhanced the Traces tab by adding client-side element traces. We also made it easier and faster for you to find and resolve any bottlenecks, highlighting only the most critical traces that indicate performance issues or errors. Additionally, the App Health dashboard now includes intuitive client data visualization, allowing you to seamlessly monitor, detect, and address issues impacting user experience.
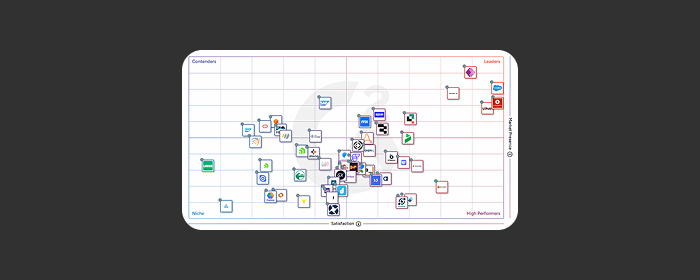
Keep learning with our resourcesG2 Data: Why enterprises build apps and agents on OutSystemsUsers rank OutSystems a top platform for apps and AI agents.Get infographicG2 Grid Report for Low-Code Development Platforms, 2026OutSystems is a Leader, earning a perfect 100 satisfaction score.Get the ReportG2 2026 AI Agent Builder Grid: OutSystems Named a LeaderLearn why OutSystems achieved Leader status with a 95 NPS.Get the reportCheck out all our Resources