OutSystems Analytics pour surveiller les performances des agents et applications
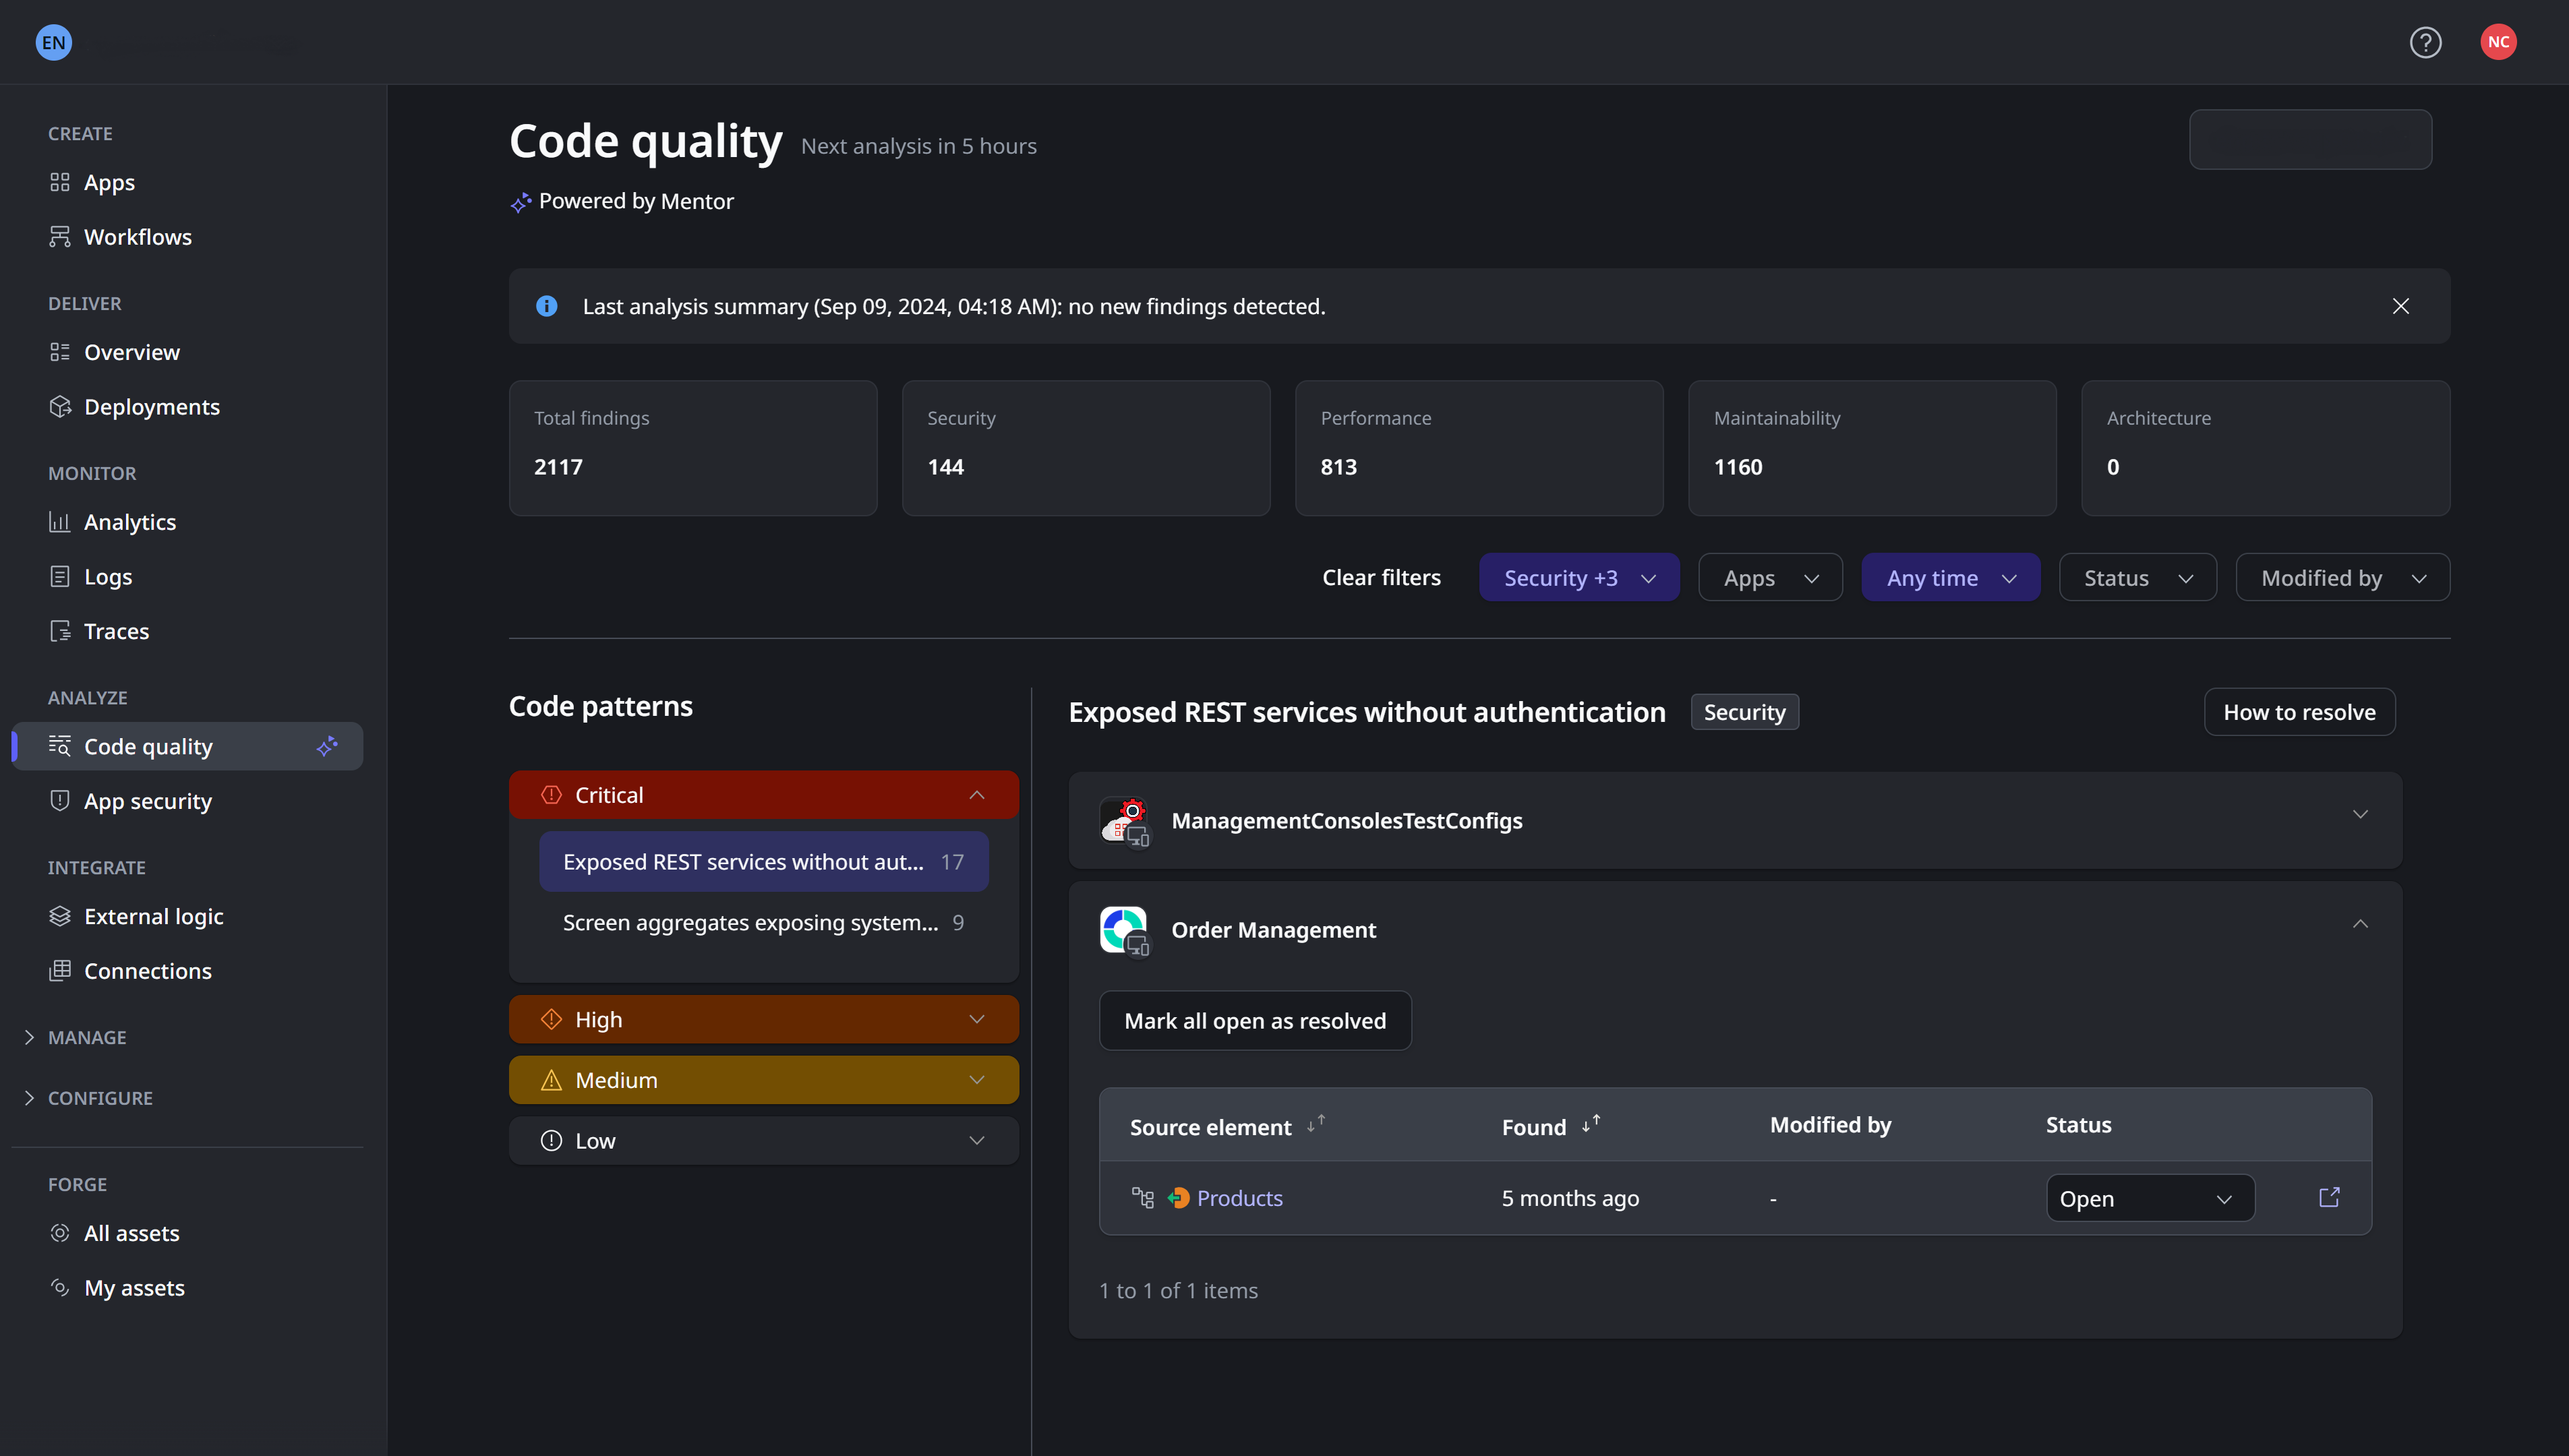
Grâce à OutSystems Analytics, obtenez une vue à 360° de l’ensemble de votre portefeuille. Identifiez les problèmes avant qu’ils ne deviennent critiques et résolvez-les en quelques minutes, pas en heures. Profitez d’une surveillance intelligente intégrée, alimentée par l’IA et OpenTelemetry, pour créer des applications cloud natives et des agents personnalisés à la fois performants, fiables et conformes aux exigences de votre entreprise.


Simplifiez la surveillance et l’observabilité
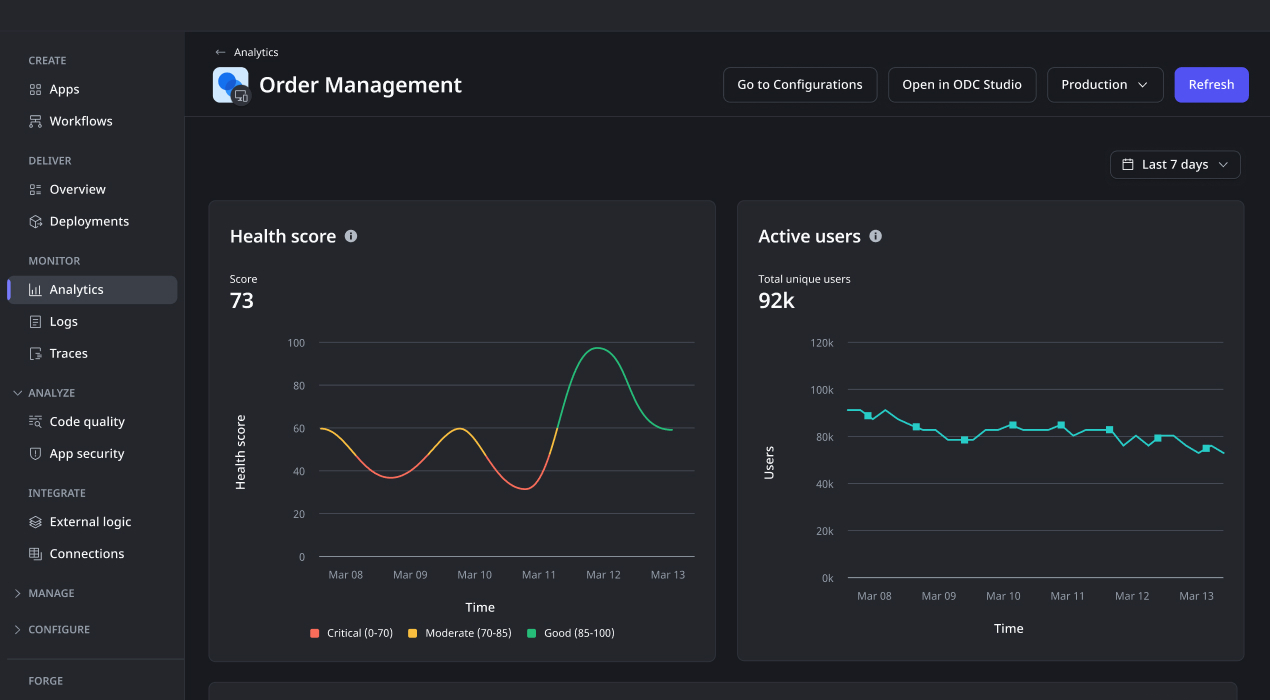
Obtenez une observabilité complète de bout en bout sans instrumentation manuelle ni intégrations complexes. Suivez en temps réel les performances de vos applications, agents et jetons d’accès. Grâce à une télémétrie complète (journaux, traces, métriques) sur tout le cycle de développement, vous identifiez et résolvez les problèmes plus rapidement pour une expérience utilisateur toujours fluide.


Concevez des applications performantes et agents avec moins d’effort
Livrez des applications et des agents fiables en toute confiance. Les outils intégrés d’OutSystems auditent automatiquement vos projets pour garantir performance et accessibilité à chaque étape du développement. Simplifiez la création d’applications de haute qualité grâce à une IA qui veille sur vos performances.

"Les capacités DevOps d’OutSystems, telles que le déploiement en un clic et la surveillance des performances, réduisent les coûts de maintenance et nous permettent d’investir davantage dans l’innovation.”

Une vue unifiée pour toute votre organisation
Marre de jongler entre plusieurs outils ? OutSystems centralise toutes vos données de performance (applications, agents, infrastructure et expérience utilisateur) dans un seul et même portail. Grâce à OpenTelemetry, automatisez la collecte de données et visualisez tout votre écosystème dans l’outil APM de votre choix.

Boostez la productivité des développeurs
Accélérez le dépannage et réduisez le temps moyen de rétablissement (MTTR) grâce à l’analyse automatisée de la cause racine. Des vues intuitives par application, agent ou composant facilitent l’identification rapide des problèmes, sans débogage fastidieux.
Transformez les données utilisateur en meilleures expériences
Comprenez comment vos utilisateurs perçoivent les performances de vos applications. Exploitez les traces côté client et les analyses d’expérience numérique pour améliorer continuellement la satisfaction et garder une longueur d’avance sur la concurrence.
App performance monitoring
FAQ
OutSystems integrates with existing APM tools by streaming open telemetry standard logs, traces and metrics into external monitoring platforms such as New Relic, Splunk, Dynatrace, and AppDynamics. This lets teams keep their current centralized observability stack while monitoring OutSystems applications alongside the rest of their enterprise systems.
Log streaming sends application and platform logs from OutSystems to an external observability or monitoring tool. It helps teams analyze errors, performance events, security activity, and operational behavior in near real time. With log streaming, organizations can centralize monitoring data and investigate issues using their preferred tools.
OutSystems provides out-of-the-box app and agent performance metrics such as response times, request volume, errors, slow queries, and server activity (user activity, drill-down to each app element, app health / Apdex). These metrics help teams identify bottlenecks, troubleshoot issues, and understand how applications behave in production without needing to build custom monitoring from scratch.
Yes. OutSystems supports app and agent monitoring and standard open telemetry standard tracing across client-side and server-side activity, helping teams understand the full path of a user interaction. This end-to-end visibility makes it easier to diagnose slow screens, backend service issues, integration delays, and performance problems that affect the user experience.
OutSystems includes built-in app and agent analytics that help teams understand application and agent usage, adoption, performance, and operational behavior. These analytics tools provide visibility into how software is running and how users interact with them, while also allowing teams to extend reporting through external BI or monitoring systems when needed.
Yes. OutSystems can track application and agent usage, including geographical distribution of users, errors, overall end-user response time, access frequency, and the areas of an app that are most active. This helps teams measure adoption, identify underused functionality, improve user experience, and prioritize future enhancements based on real usage patterns.
Yes. OutSystems supports extracting analytics via open telemetry streaming, and operational data for use in external reporting tools, BI platforms, or custom dashboards. This allows teams to combine application data with other enterprise metrics, create tailored reports, and maintain centralized visibility across business, performance, and user adoption trends.
OutSystems provides APIs and platform services in O11 that allow teams to access performance, usage, and analytics data programmatically. These can support custom dashboards, external reporting, operational workflows, or integration with observability tools. The available approach depends on the data type, deployment model, and reporting requirements.
Analytics data retention depends on the OutSystems environment, configuration, and deployment model. Teams should confirm retention requirements based on their reporting, compliance, and operational needs. For long-term app and agent data analysis, organizations can export or stream relevant metrics into external analytics, BI, or observability platforms.


Créez ce qui est dans votre carnet de commandes
Explorez une vaste bibliothèque de cas d’usage, modèles et solutions partenaires pour répondre à tous vos besoins applicatifs.

Découvrez ce qui distingue OutSystems
Obtenez les dernières études sur les plateformes Low-Code menées par les analystes de l'industrie mondiale et découvrez pourquoi OutSystems est reconnue comme la plateforme de développement Low-Code n°1 pilotée par l'IA.

Approfondissez votre connaissance de la plateforme
Obtenez plus de détails sur la manière dont votre équipe peut créer rapidement des applications critiques. Consultez notre guide d'évaluation.