OutSystems Analytics for agent and app performance monitoring
Get a 360º view of your entire app and agent portfolio—so you can catch issues before they become problems. With the power of AI and OpenTelemetry at your fingertips, you can spot and solve problems in minutes, not hours. Work smarter and deliver cloud-native apps and custom agents users will love—all with the trust, security, and compliance your enterprise requires.


Simplify agent and app monitoring
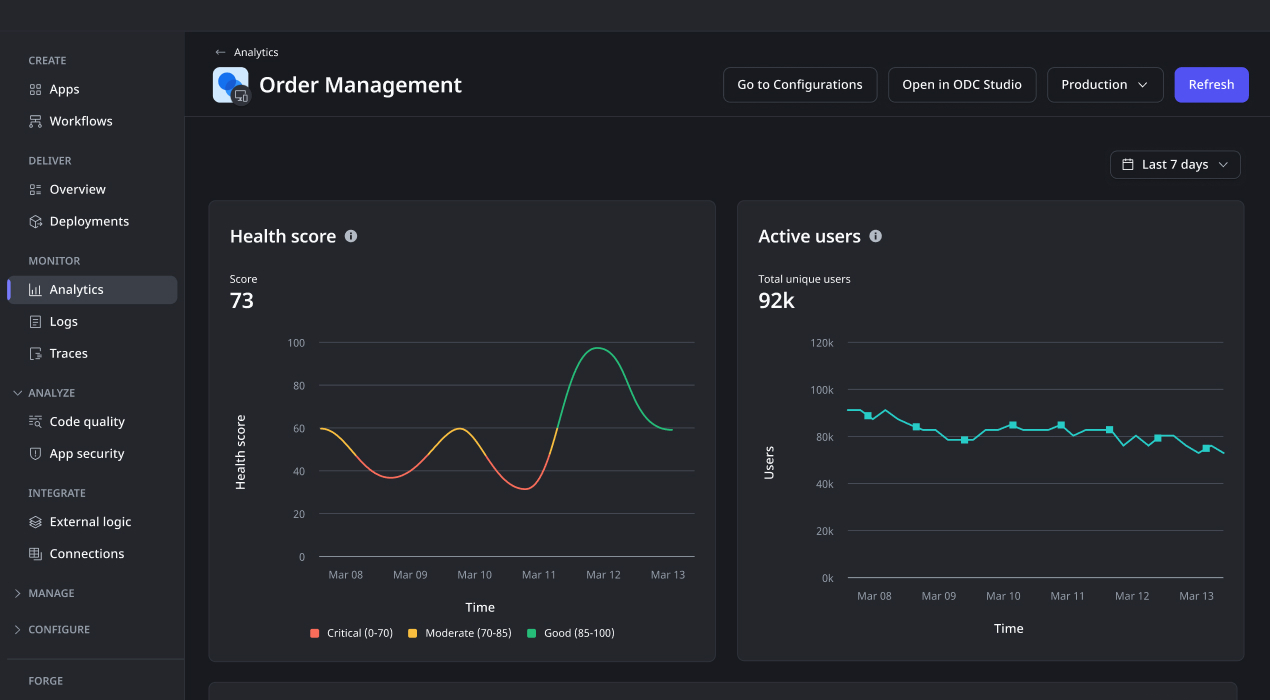
Get full-stack observability and monitoring, no manual instrumentation, data mapping, or complex integrations required. Gain real-time insights into app and agent performance and token usage. With end-to-end monitoring and complete telemetry—logs, traces, and metrics—across all dev stages, you can identify issues fast, troubleshoot with ease, and optimize for a superior user experience.


Build performant apps and reliable agents with less effort
Deliver winning apps and agents with confidence knowing that you have a full view of your portfolio's health. With built-in AI-driven capabilities that audit your apps and agents for performance and accessibility throughout the development process, OutSystems makes it simple to produce high-quality apps and reliable agents.

“The DevOps capabilities of OutSystems, like one-click deployment and performance monitoring, mean the apps we deliver this way are less costly to update and maintain. That means we can invest more in innovation that will keep the company competitive into the future.”

Get a unified view into agent and app performance with one tool
Tired of jumping between tools to understand what’s happening across your portfolio? Automate performance monitoring with OpenTelemetry and pull together data from your entire portfolio—apps, agents, and telemetry infrastructure, plus user experience insights—all in the OutSystems portal or the APM tool of your choice.

Improve developer productivity through simplified DevOps
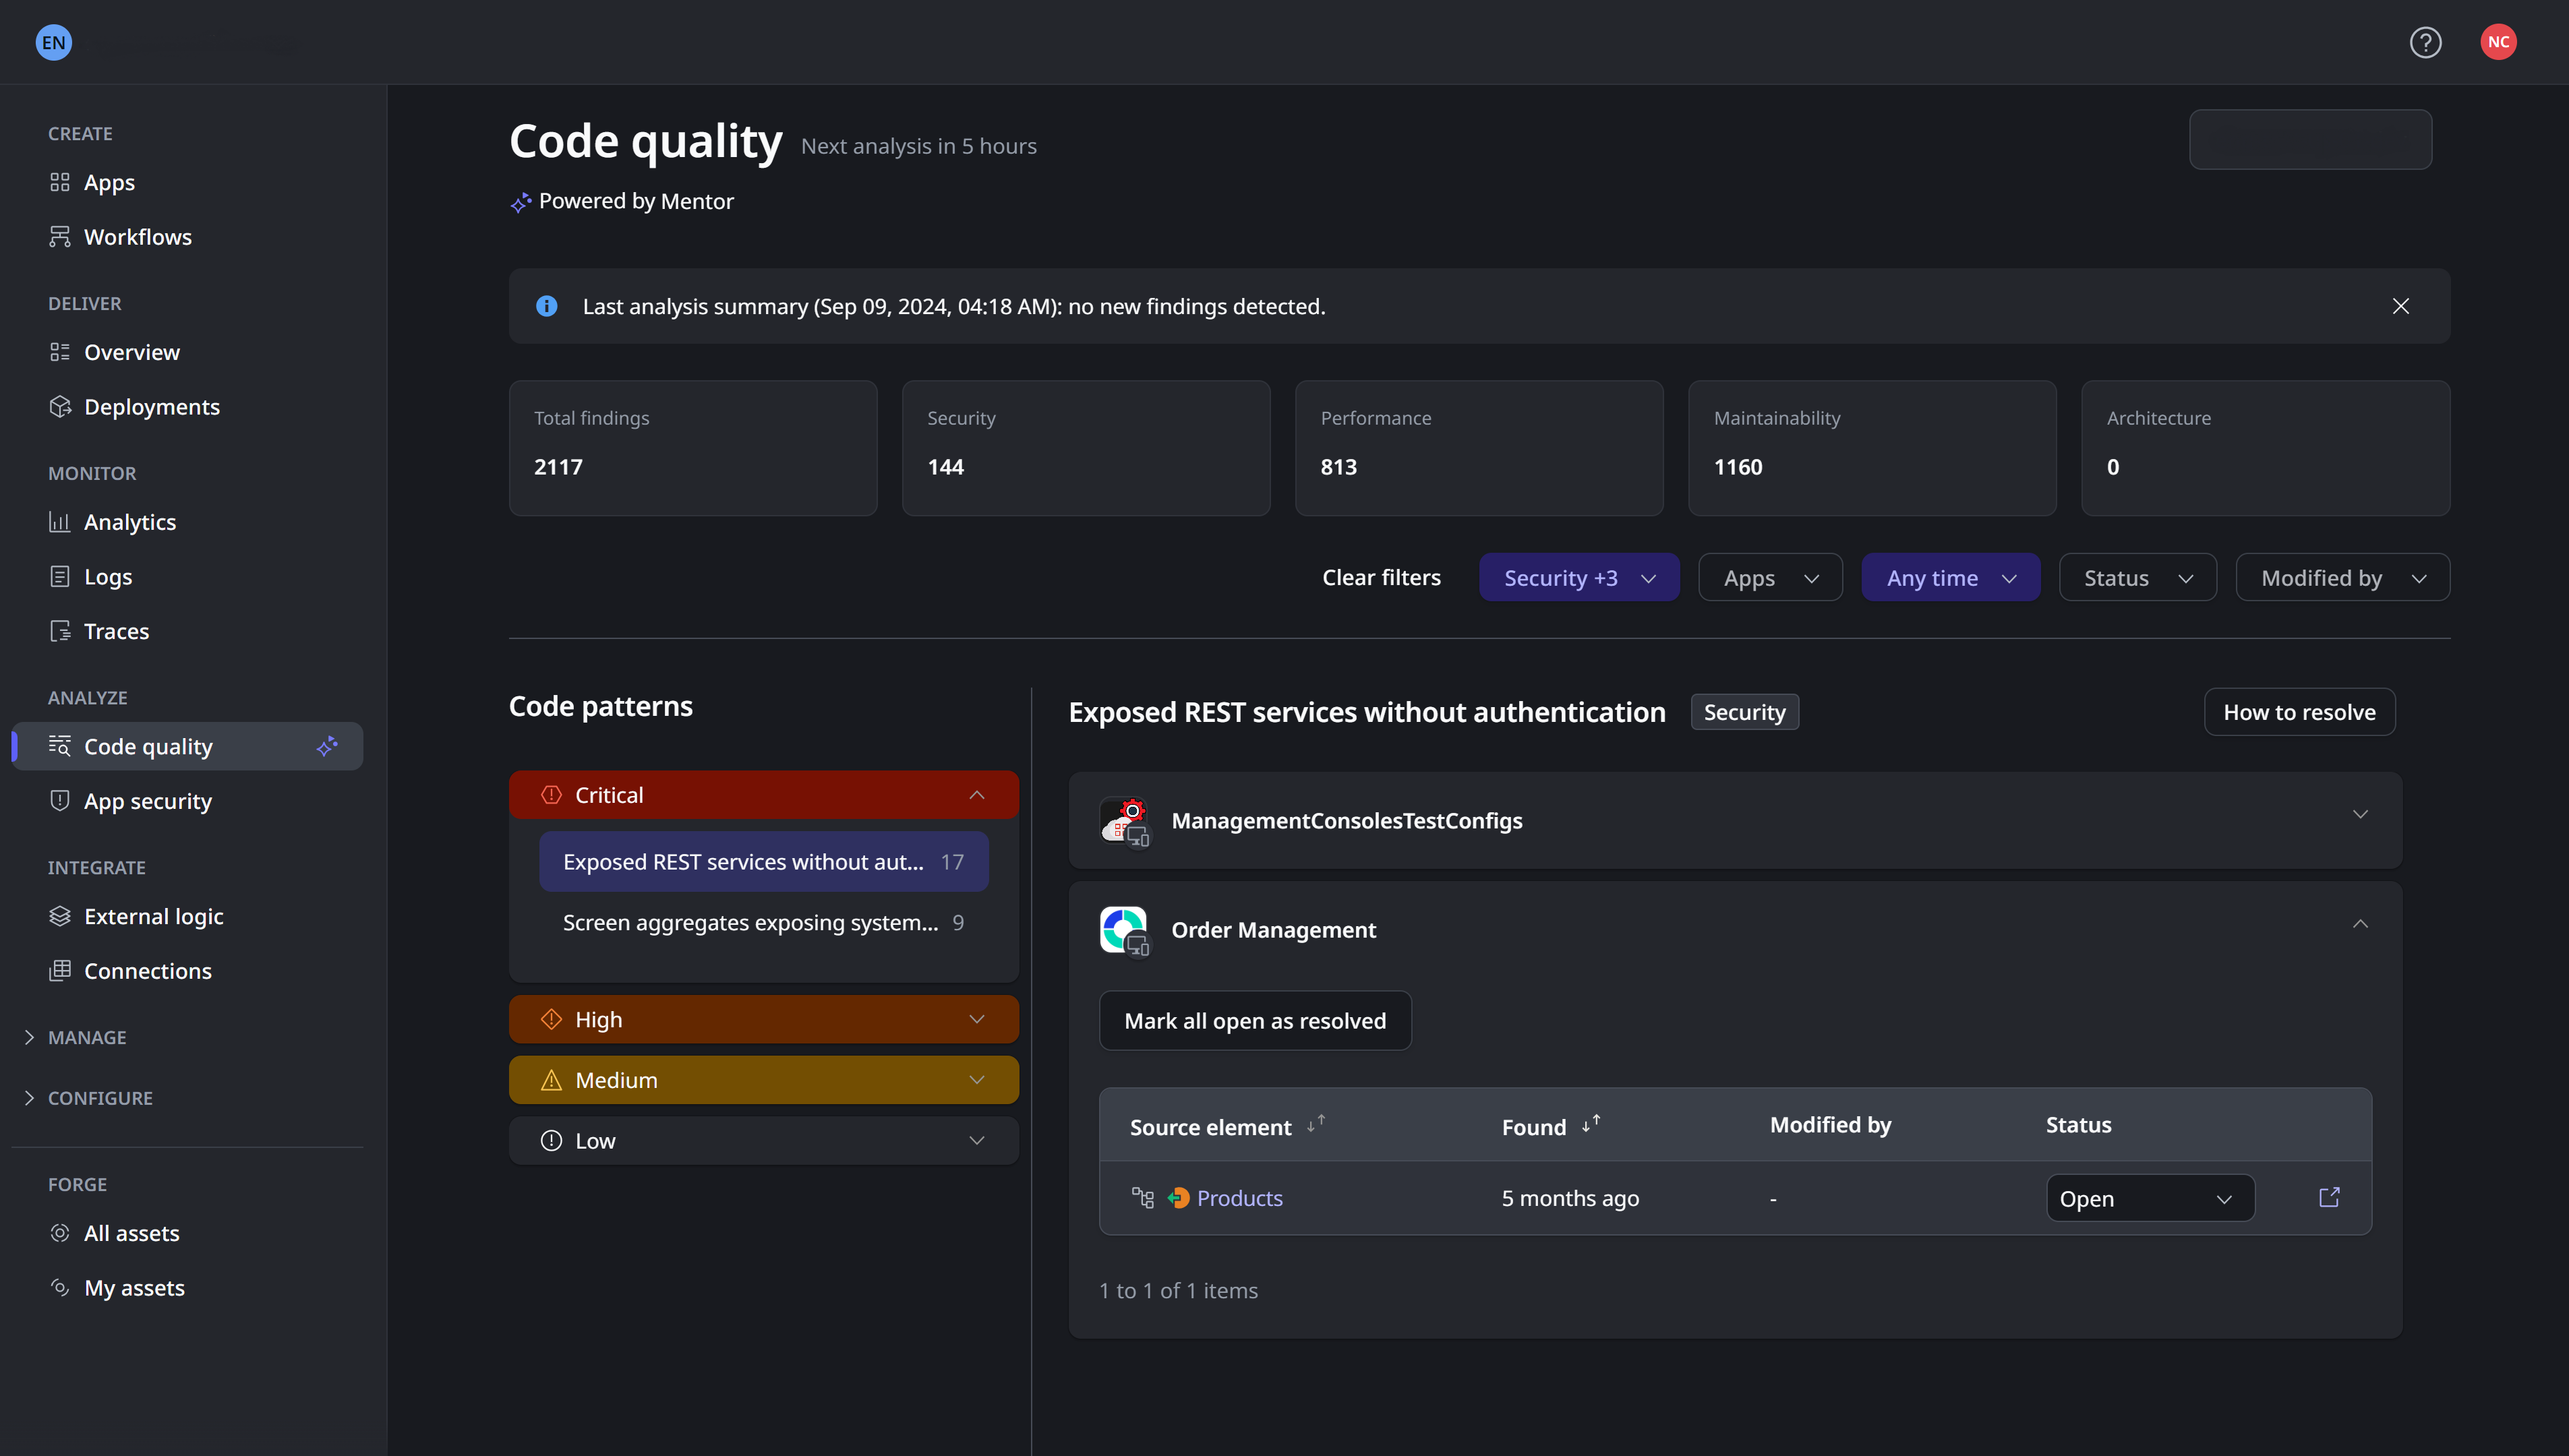
Pinpoint issues easily and speed up troubleshooting using automated root cause analysis that reduces Mean Time to Recovery (MTTR). Dive into performance with intuitive app-, agent-, and element-level drill-down views to quickly identify performance issues—no debugging or guesswork required.
Turn user data into better experiences
Utilize user experience data to better understand user perspective on your app performance. Leverage these insights for troubleshooting scenarios and to implement improvements that align with user needs. Client-side traces and digital user experience analytics gives you what you need to exceed user expectations and stay ahead of the competition.
App performance monitoring
FAQ
OutSystems integrates with existing APM tools by streaming open telemetry standard logs, traces and metrics into external monitoring platforms such as New Relic, Splunk, Dynatrace, and AppDynamics. This lets teams keep their current centralized observability stack while monitoring OutSystems applications alongside the rest of their enterprise systems.
Log streaming sends application and platform logs from OutSystems to an external observability or monitoring tool. It helps teams analyze errors, performance events, security activity, and operational behavior in near real time. With log streaming, organizations can centralize monitoring data and investigate issues using their preferred tools.
OutSystems provides out-of-the-box app and agent performance metrics such as response times, request volume, errors, slow queries, and server activity (user activity, drill-down to each app element, app health / Apdex). These metrics help teams identify bottlenecks, troubleshoot issues, and understand how applications behave in production without needing to build custom monitoring from scratch.
Yes. OutSystems supports app and agent monitoring and standard open telemetry standard tracing across client-side and server-side activity, helping teams understand the full path of a user interaction. This end-to-end visibility makes it easier to diagnose slow screens, backend service issues, integration delays, and performance problems that affect the user experience.
OutSystems includes built-in app and agent analytics that help teams understand application and agent usage, adoption, performance, and operational behavior. These analytics tools provide visibility into how software is running and how users interact with them, while also allowing teams to extend reporting through external BI or monitoring systems when needed.
Yes. OutSystems can track application and agent usage, including geographical distribution of users, errors, overall end-user response time, access frequency, and the areas of an app that are most active. This helps teams measure adoption, identify underused functionality, improve user experience, and prioritize future enhancements based on real usage patterns.
Yes. OutSystems supports extracting analytics via open telemetry streaming, and operational data for use in external reporting tools, BI platforms, or custom dashboards. This allows teams to combine application data with other enterprise metrics, create tailored reports, and maintain centralized visibility across business, performance, and user adoption trends.
OutSystems provides APIs and platform services in O11 that allow teams to access performance, usage, and analytics data programmatically. These can support custom dashboards, external reporting, operational workflows, or integration with observability tools. The available approach depends on the data type, deployment model, and reporting requirements.
Analytics data retention depends on the OutSystems environment, configuration, and deployment model. Teams should confirm retention requirements based on their reporting, compliance, and operational needs. For long-term app and agent data analysis, organizations can export or stream relevant metrics into external analytics, BI, or observability platforms.


Build what’s in your backlog
The broadest range of use cases, templates, and powerful partner solutions help you tackle everything in your application backlog.

See how OutSystems stacks up
Get the latest research on low-code platforms from global industry analysts and see why OutSystems is known as the #1 AI-powered low-code platform.

Go deeper into the platform
Get more details about how your team can build mission-critical applications fast. Browse our evaluation guide.