
If you’ve never created a chart in OutSystems, start today by checking the three new documentation topics that guide you through creating your first chart. We've got pie and donut charts, column and bar charts, and line and area charts! If you already know how to create charts, take data visualization to the next level, by checking out the new advanced charts customization topic.

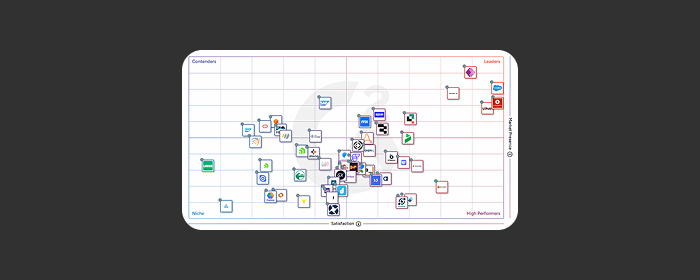

Keep learning with our resourcesG2 Data: Why enterprises build apps and agents on OutSystemsUsers rank OutSystems a top platform for apps and AI agents.Get infographicG2 Grid Report for Low-Code Development Platforms, 2026OutSystems is a Leader, earning a perfect 100 satisfaction score.Get the ReportG2 2026 AI Agent Builder Grid: OutSystems Named a LeaderLearn why OutSystems achieved Leader status with a 95 NPS.Get the reportCheck out all our Resources