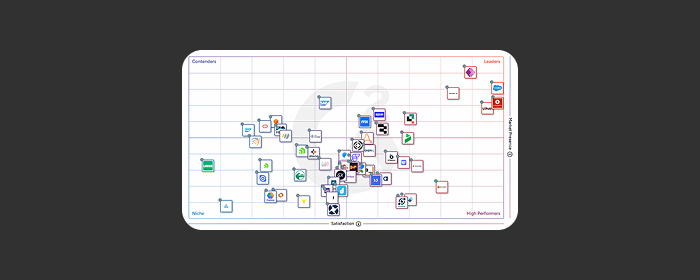
Keep learning with our resourcesG2 Data: Why enterprises build apps and agents on OutSystemsUsers rank OutSystems a top platform for apps and AI agents.Get infographicG2 Grid Report for Low-Code Development Platforms, 2026OutSystems is a Leader, earning a perfect 100 satisfaction score.Get the ReportG2 2026 AI Agent Builder Grid: OutSystems Named a LeaderLearn why OutSystems achieved Leader status with a 95 NPS.Get the reportCheck out all our Resources