Can I build reports and dashboards with OutSystems?
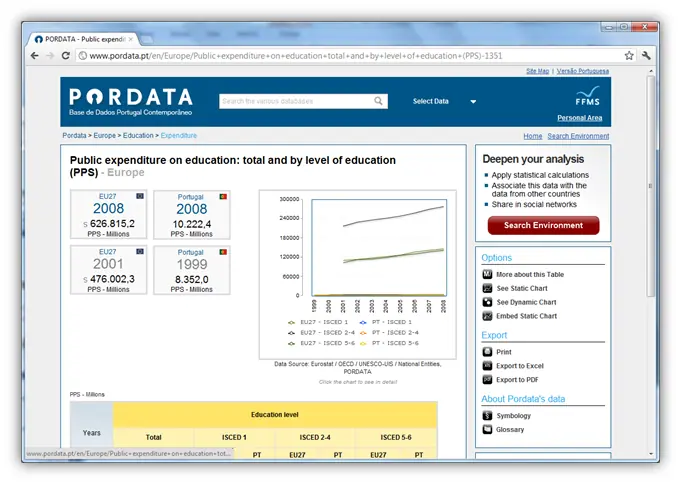
Yes. A publicly available example of the dashboard capabilities of OutSystems is Pordata:
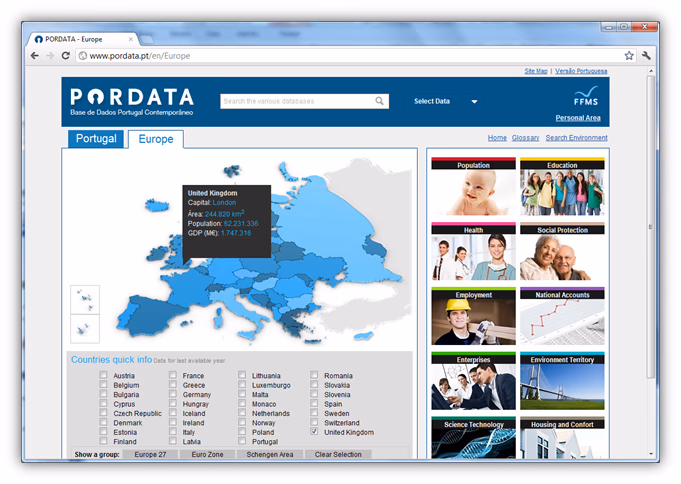
Outsystems has a number of facilities developers can use to build reports and dashboards and incorporate them into their applications:
- An extensive set of charting widgets available out of the box.
- Visual data aggregation capabilities
- Powerful charting library
- Open architecture that enables incorporation of any HTML/CSS/JavaScript reporting widget
- Export to Excel
- Export to PDF
The charting widgets, based on pure HTML5 and JavaScript, offer intuitive, interactive charts that work seamlessly across desktop browsers or mobile devices. The bundled visual API can be used to deliver data. OutSystems also allows the visual design and exposure of SOAP/XML web services, which can be used as a data source for several reporting tool, and the database. Developers can focus on which insights will better help business users and OutSystems takes care of the technical implementation. Additional dashboard and charting capabilities can be integrated with third-party libraries or tools.
In an advanced scenario, like integrating with BI tools, OutSystems has an open architecture that works perfectly with the vast majority of business intelligence or data reporting toolsets.
The database on which OutSystems application are deployed, is a standard SQL Server or Oracle database. You can access the underlying database from external conventional tools, and follow a conventional process to consume the data.