OutSystems Analytics für Agenten- und Applikations-Performance-Monitoring
Erhalten Sie eine 360º-Ansicht Ihres gesamten App- und Agenten-Portfolios – damit Sie Probleme erkennen, bevor sie kritisch werden. Mit der Leistungsfähigkeit von KI und OpenTelemetry können Sie Probleme in Minuten statt Stunden erkennen und lösen. Arbeiten Sie smarter und liefern Sie Cloud-native Apps und individuelle KI-Agenten, die Anwender begeistern werden – mit der Zuverlässigkeit, Sicherheit und Compliance, die Ihr Unternehmen benötigt.


Agenten- und App-Monitoring vereinfachen
Erhalten Sie Full-Stack-Observability und Monitoring, ohne manuelle Instrumentierung, Datenzuordnung oder komplexe Integrationen. Gewinnen Sie Echtzeit-Einblicke in die App- und Agenten-Performance sowie die Token-Nutzung. Mit End-to-End-Monitoring und vollständiger Telemetrie (Logs, Traces und Metriken) über alle Entwicklungsphasen hinweg können Sie Probleme schnell identifizieren, mühelos beheben und für ein herausragendes Nutzungserlebnis optimieren.


Performante Apps und zuverlässige KI-Agenten mit weniger Aufwand erstellen
Liefern Sie erfolgreiche Apps und Agenten mit der Gewissheit, dass Sie einen vollständigen Überblick über den Zustand Ihres Portfolios haben. Mit integrierten, KI-gesteuerten Funktionen, die Ihre Apps und Agenten während des gesamten Entwicklungsprozesses auf Performance und Barrierefreiheit prüfen, macht es OutSystems einfach, hochwertige Apps und zuverlässige Agenten zu erstellen.

„Durch die DevOps-Funktionen von OutSystems, wie One-Click Deployment und Performance-Monitoring, können wir die so gelieferten Apps kostengünstiger aktualisieren und warten. Das bedeutet, wir können mehr in Innovation investieren, mit denen das Unternehmen auch in Zukunft wettbewerbsfähig bleibt.“

Ein einheitlicher Überblick über die Agenten- und App-Performance mit einem einzigen Tool
Sind Sie es leid, zwischen Tools hin und her zu wechseln, um zu verstehen, was in Ihrem Portfolio passiert? Automatisieren Sie das Performance-Monitoring mit OpenTelemetry und führen Sie Daten aus Ihrem gesamten Portfolio – Apps, Agenten und Telemetrie-Infrastruktur, plus Einblicke in Nutzungserlebnisse – im OutSystems-Portal oder dem APM-Tool Ihrer Wahl zusammen.

Höhere Entwicklerproduktivität durch vereinfachtes DevOps
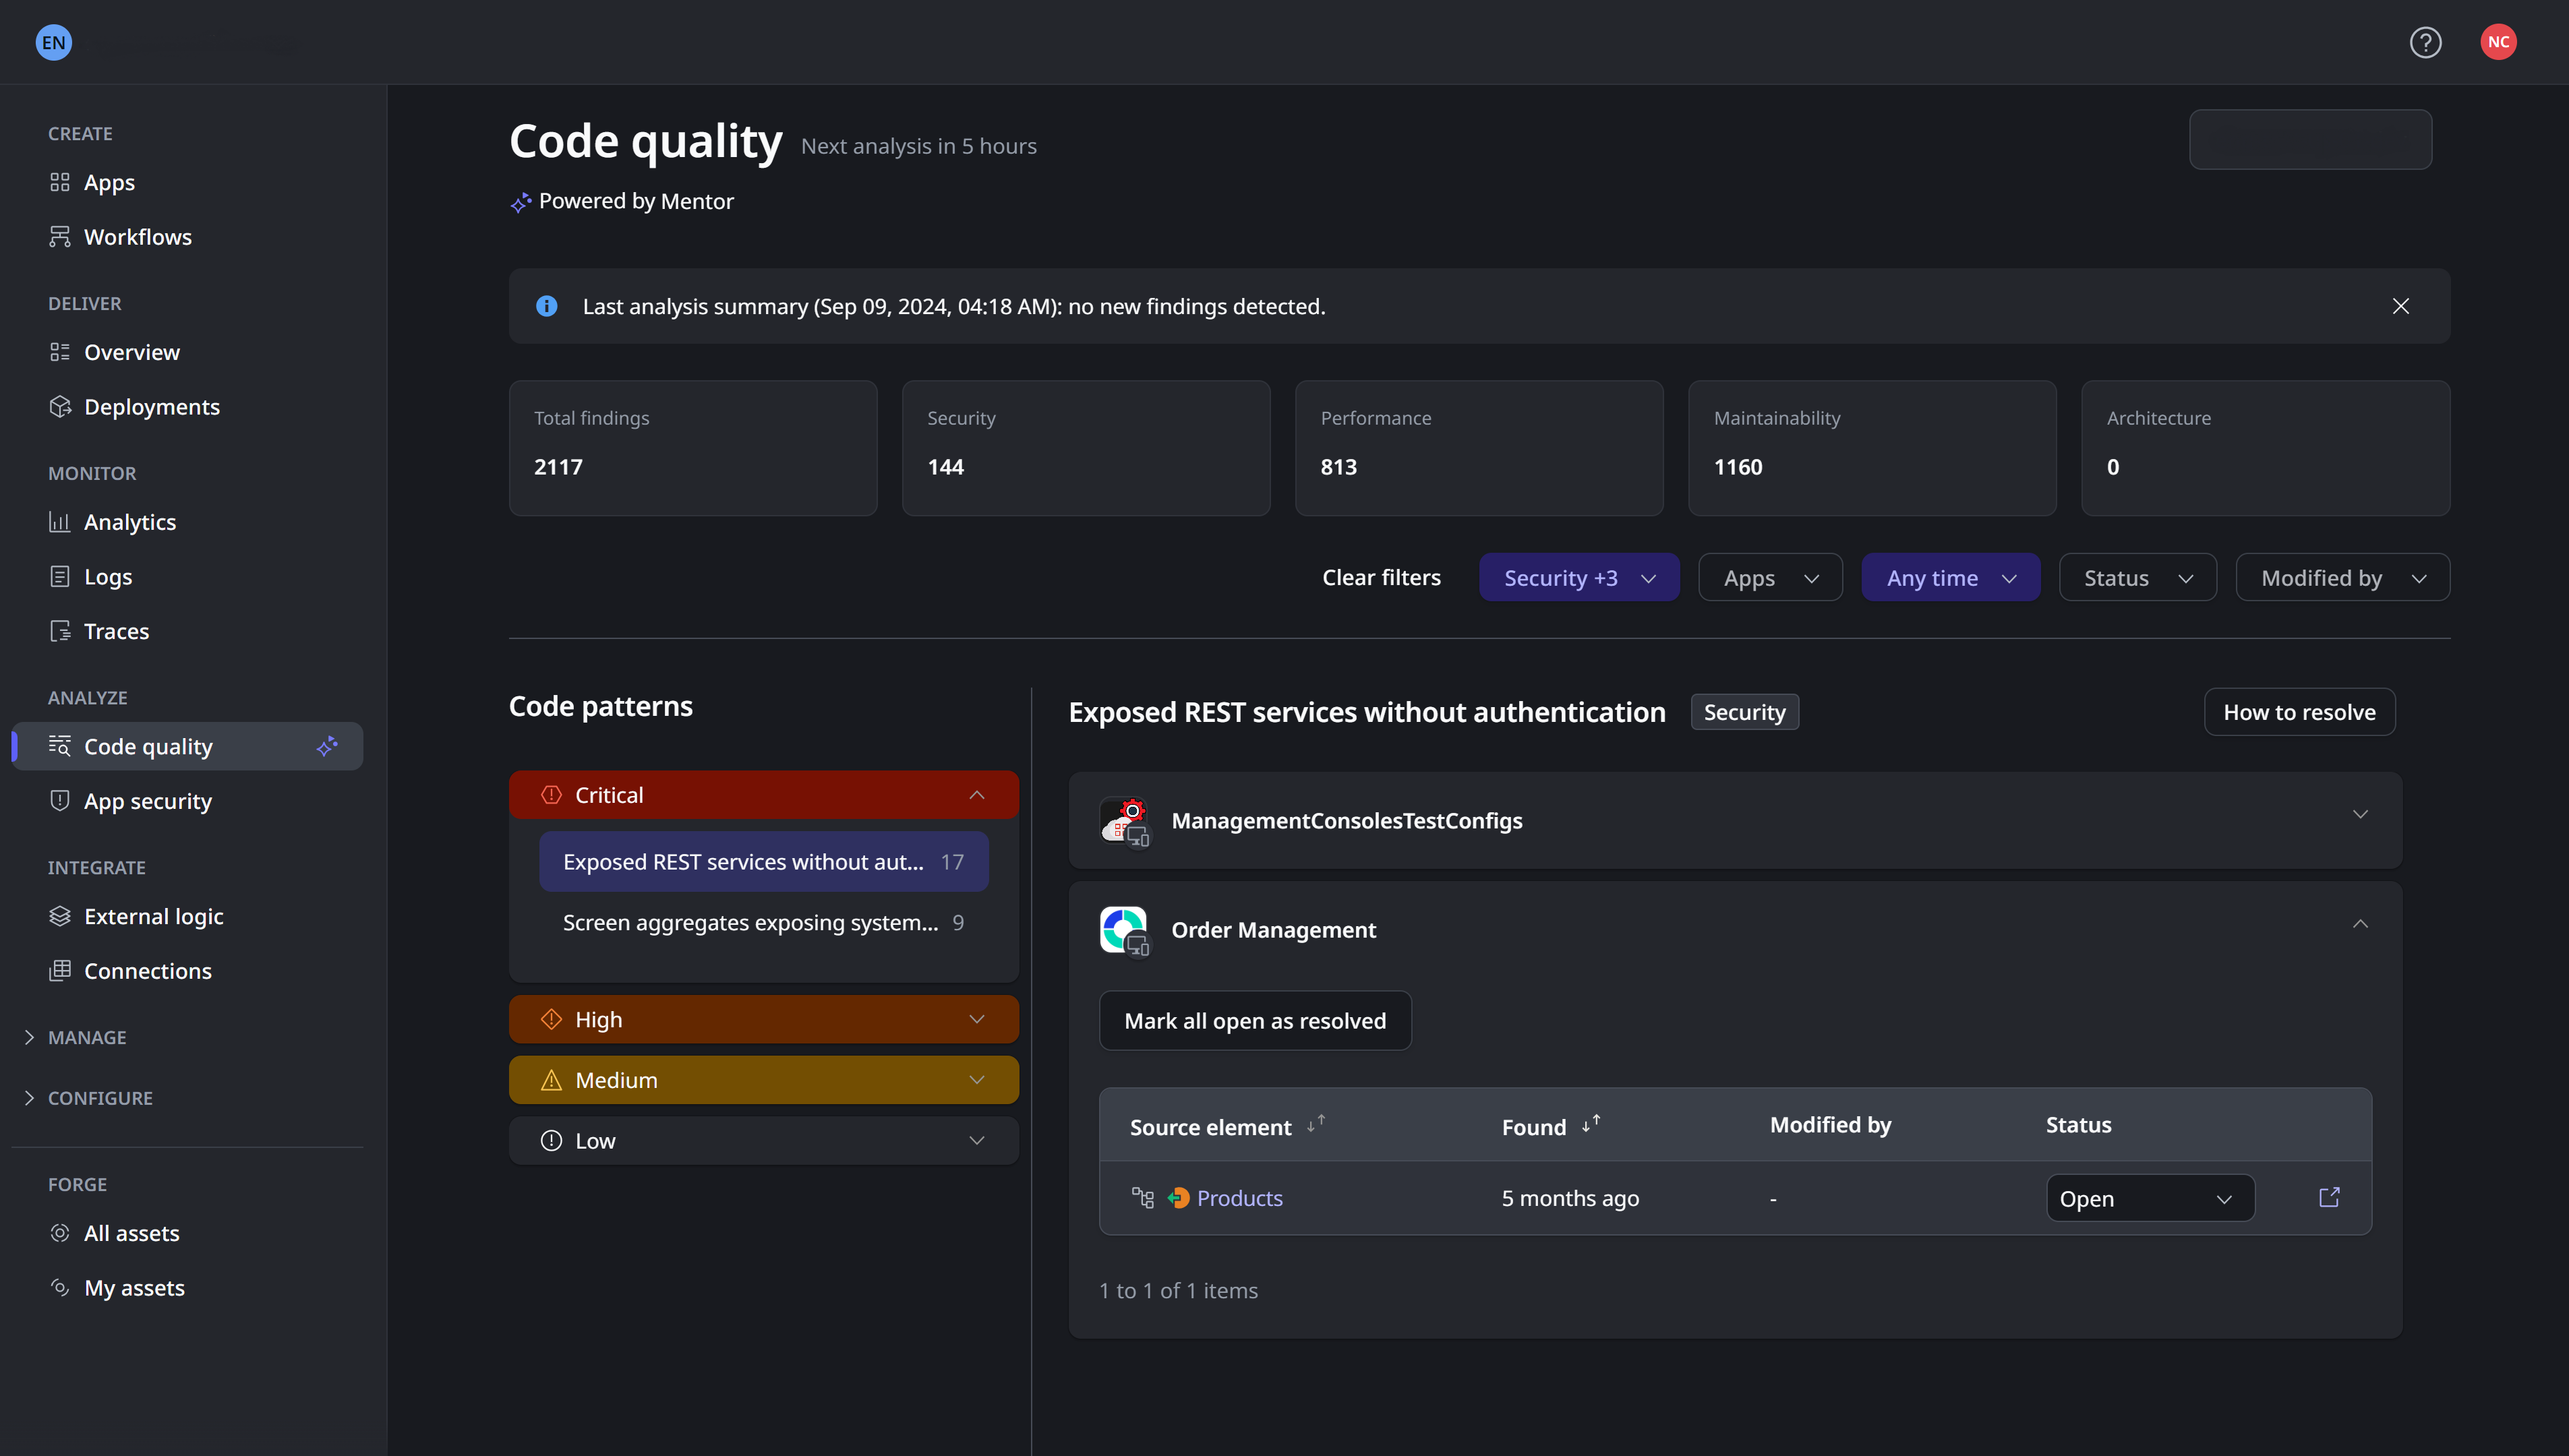
Lokalisieren Sie Probleme einfach und beschleunigen Sie die Fehlerbehebung, indem Sie die automatisierte Ursachenanalyse nutzen, die die Mean Time to Recovery (MTTR) reduziert. Tauchen Sie tief in die Performance ein mit intuitiven Drill-down-Ansichten auf App-, Agenten- und Elementebene, um Performance-Probleme schnell zu identifizieren – Debugging oder Rätselraten sind überflüssig.
Nutzerdaten in bessere Erlebnisse verwandeln
Nutzen Sie Daten zur User Experience, um die Nutzerperspektive auf Ihre App-Performance besser zu verstehen. Verwenden Sie diese Einblicke für Troubleshooting-Szenarien und zur Implementierung von Verbesserungen, die sich an den Nutzeranforderungen orientieren. Client-seitige Traces und digitale User Experience Analytics geben Ihnen das, was Sie benötigen, um die Erwartungen der Nutzer zu übertreffen und Wettbewerbern einen Schritt voraus zu sein.
App performance monitoring
FAQ
OutSystems integrates with existing APM tools by streaming open telemetry standard logs, traces and metrics into external monitoring platforms such as New Relic, Splunk, Dynatrace, and AppDynamics. This lets teams keep their current centralized observability stack while monitoring OutSystems applications alongside the rest of their enterprise systems.
Log streaming sends application and platform logs from OutSystems to an external observability or monitoring tool. It helps teams analyze errors, performance events, security activity, and operational behavior in near real time. With log streaming, organizations can centralize monitoring data and investigate issues using their preferred tools.
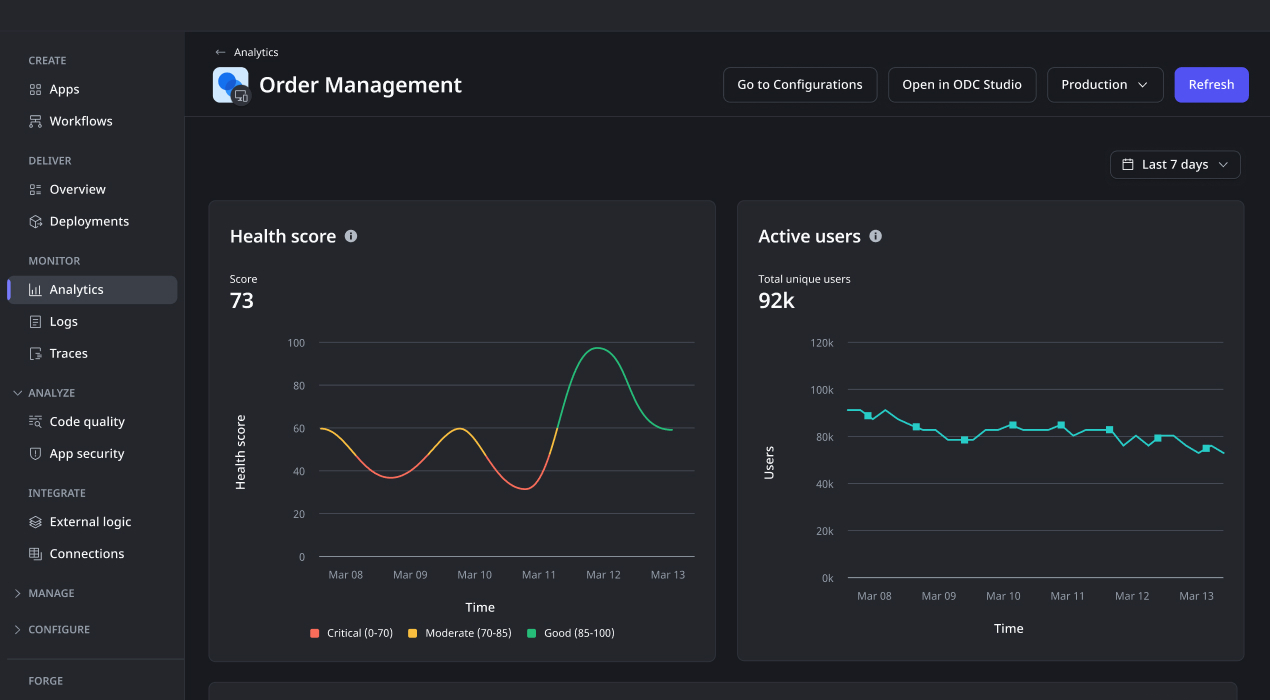
OutSystems provides out-of-the-box app and agent performance metrics such as response times, request volume, errors, slow queries, and server activity (user activity, drill-down to each app element, app health / Apdex). These metrics help teams identify bottlenecks, troubleshoot issues, and understand how applications behave in production without needing to build custom monitoring from scratch.
Yes. OutSystems supports app and agent monitoring and standard open telemetry standard tracing across client-side and server-side activity, helping teams understand the full path of a user interaction. This end-to-end visibility makes it easier to diagnose slow screens, backend service issues, integration delays, and performance problems that affect the user experience.
OutSystems includes built-in app and agent analytics that help teams understand application and agent usage, adoption, performance, and operational behavior. These analytics tools provide visibility into how software is running and how users interact with them, while also allowing teams to extend reporting through external BI or monitoring systems when needed.
Yes. OutSystems can track application and agent usage, including geographical distribution of users, errors, overall end-user response time, access frequency, and the areas of an app that are most active. This helps teams measure adoption, identify underused functionality, improve user experience, and prioritize future enhancements based on real usage patterns.
Yes. OutSystems supports extracting analytics via open telemetry streaming, and operational data for use in external reporting tools, BI platforms, or custom dashboards. This allows teams to combine application data with other enterprise metrics, create tailored reports, and maintain centralized visibility across business, performance, and user adoption trends.
OutSystems provides APIs and platform services in O11 that allow teams to access performance, usage, and analytics data programmatically. These can support custom dashboards, external reporting, operational workflows, or integration with observability tools. The available approach depends on the data type, deployment model, and reporting requirements.
Analytics data retention depends on the OutSystems environment, configuration, and deployment model. Teams should confirm retention requirements based on their reporting, compliance, and operational needs. For long-term app and agent data analysis, organizations can export or stream relevant metrics into external analytics, BI, or observability platforms.


Abarbeiten, was sich im Backlog befindet
Die breiteste Palette an Use Cases, Templates und leistungsstarken Partnerlösungen hilft Ihnen, alle Einträge in Ihrem Applikations-Backlog abzuarbeiten.

Erfahren Sie, wie OutSystems abschneidet
Erhalten Sie die neuesten Forschungsergebnisse zu Low-Code-Plattformen von globalen Branchenanalysten und sehen Sie, warum OutSystems zu den führenden KI-gestützten Low-Code Plattformen zählt.

Tiefer in die Plattform eintauchen
Erhalten Sie weitere Details darüber, wie Ihr Team schnell geschäftskritische Applikationen erstellen kann. Schauen Sie in unseren Evaluierungsleitfaden.