OutSystems Analyticsでエージェントやアプリのパフォーマンスを監視
アプリケーションやエージェントのポートフォリオ全体をあらゆる角度から確認することで、問題を早期に特定します。AIとOpenTelemetryの力を組み合わせると、問題の特定と解決に要する時間を数時間レベルから数分レベルに引き下げることができます。よりスマートに業務を進め、エンタープライズに求められる信頼性、セキュリティ、コンプライアンスを確保しつつ、ユーザー満足度の高いクラウドネイティブなアプリケーションやカスタムエージェントを提供することが可能になります。


エージェントやアプリの監視を簡素化
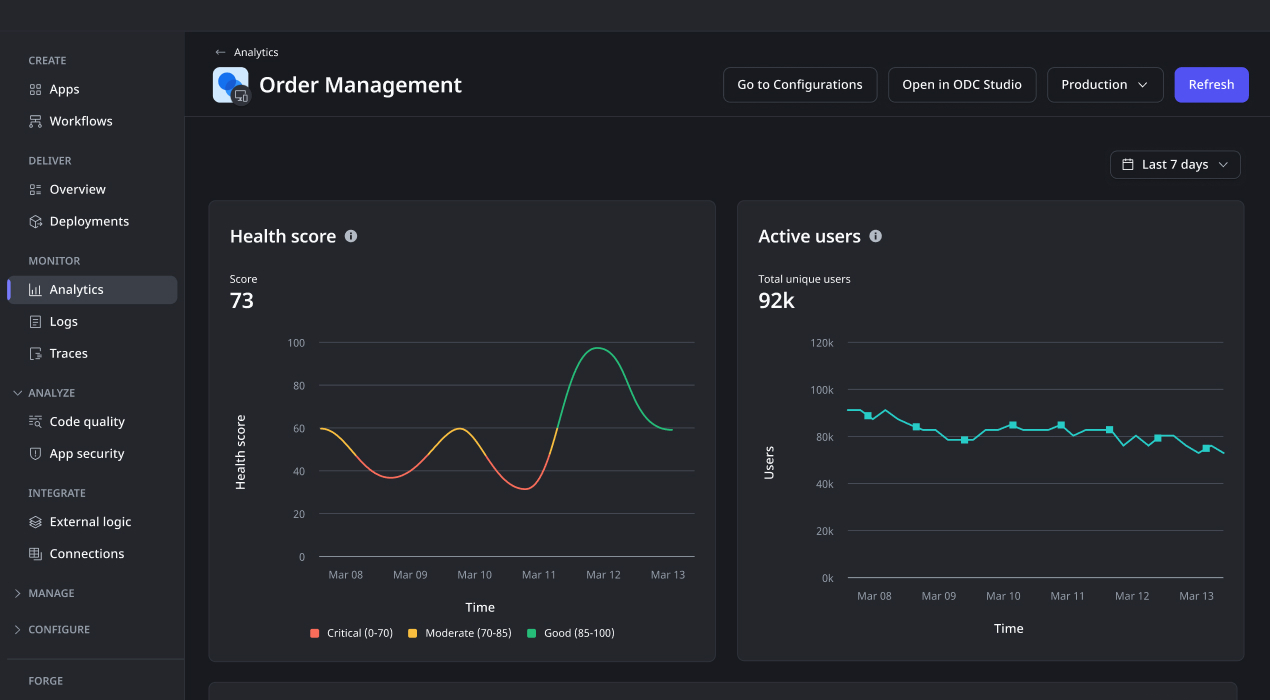
フルスタックの監視と可観測性を実現します。手動での実装、データマッピング、複雑な連携は不要です。アプリやエージェントのパフォーマンスとトークン使用量に関するリアルタイムのインサイトを取得できます。開発の全段階でのエンドツーエンドの監視と、ログ、トレース、メトリックといった完全なテレメトリーにより、問題の迅速な特定や、トラブルシューティングの負担軽減、ユーザーエクスペリエンス向上に向けた最適化が可能になります。


少ない労力で高性能なアプリや信頼性の高いエージェントを構築
ポートフォリオ全体の健全性を完全に把握できるため、成果につながるアプリやエージェントを自信を持って提供できます。開発プロセス全体を通じてアプリやエージェントのパフォーマンスとアクセシビリティを監査するビルトインのAI駆動機能により、OutSystemsは高品質なアプリや信頼性の高いエージェントの開発を簡素化します。

「ワンクリックでのデプロイやパフォーマンス監視といったOutSystemsのDevOps機能のおかげで、更新や保守にかかるコストを削減できました。これはつまり、当社の競争力を維持するためのイノベーションにより投資できるということです」
IT部門ディレクターTotal Produce

エージェントやアプリのパフォーマンスを単一のツールで一元的に把握
ポートフォリオ全体の状況を把握するために複数のツールを行き来するのは労力を要します。OpenTelemetryを使用してパフォーマンス監視を自動化し、アプリやエージェント、テレメトリーインフラ、さらにはユーザーエクスペリエンスのインサイトといったポートフォリオ全体のデータを、OutSystemsのポータルまたは任意のAPMツールで一元的に集約できます。

DevOpsの簡素化で開発者の生産性を向上
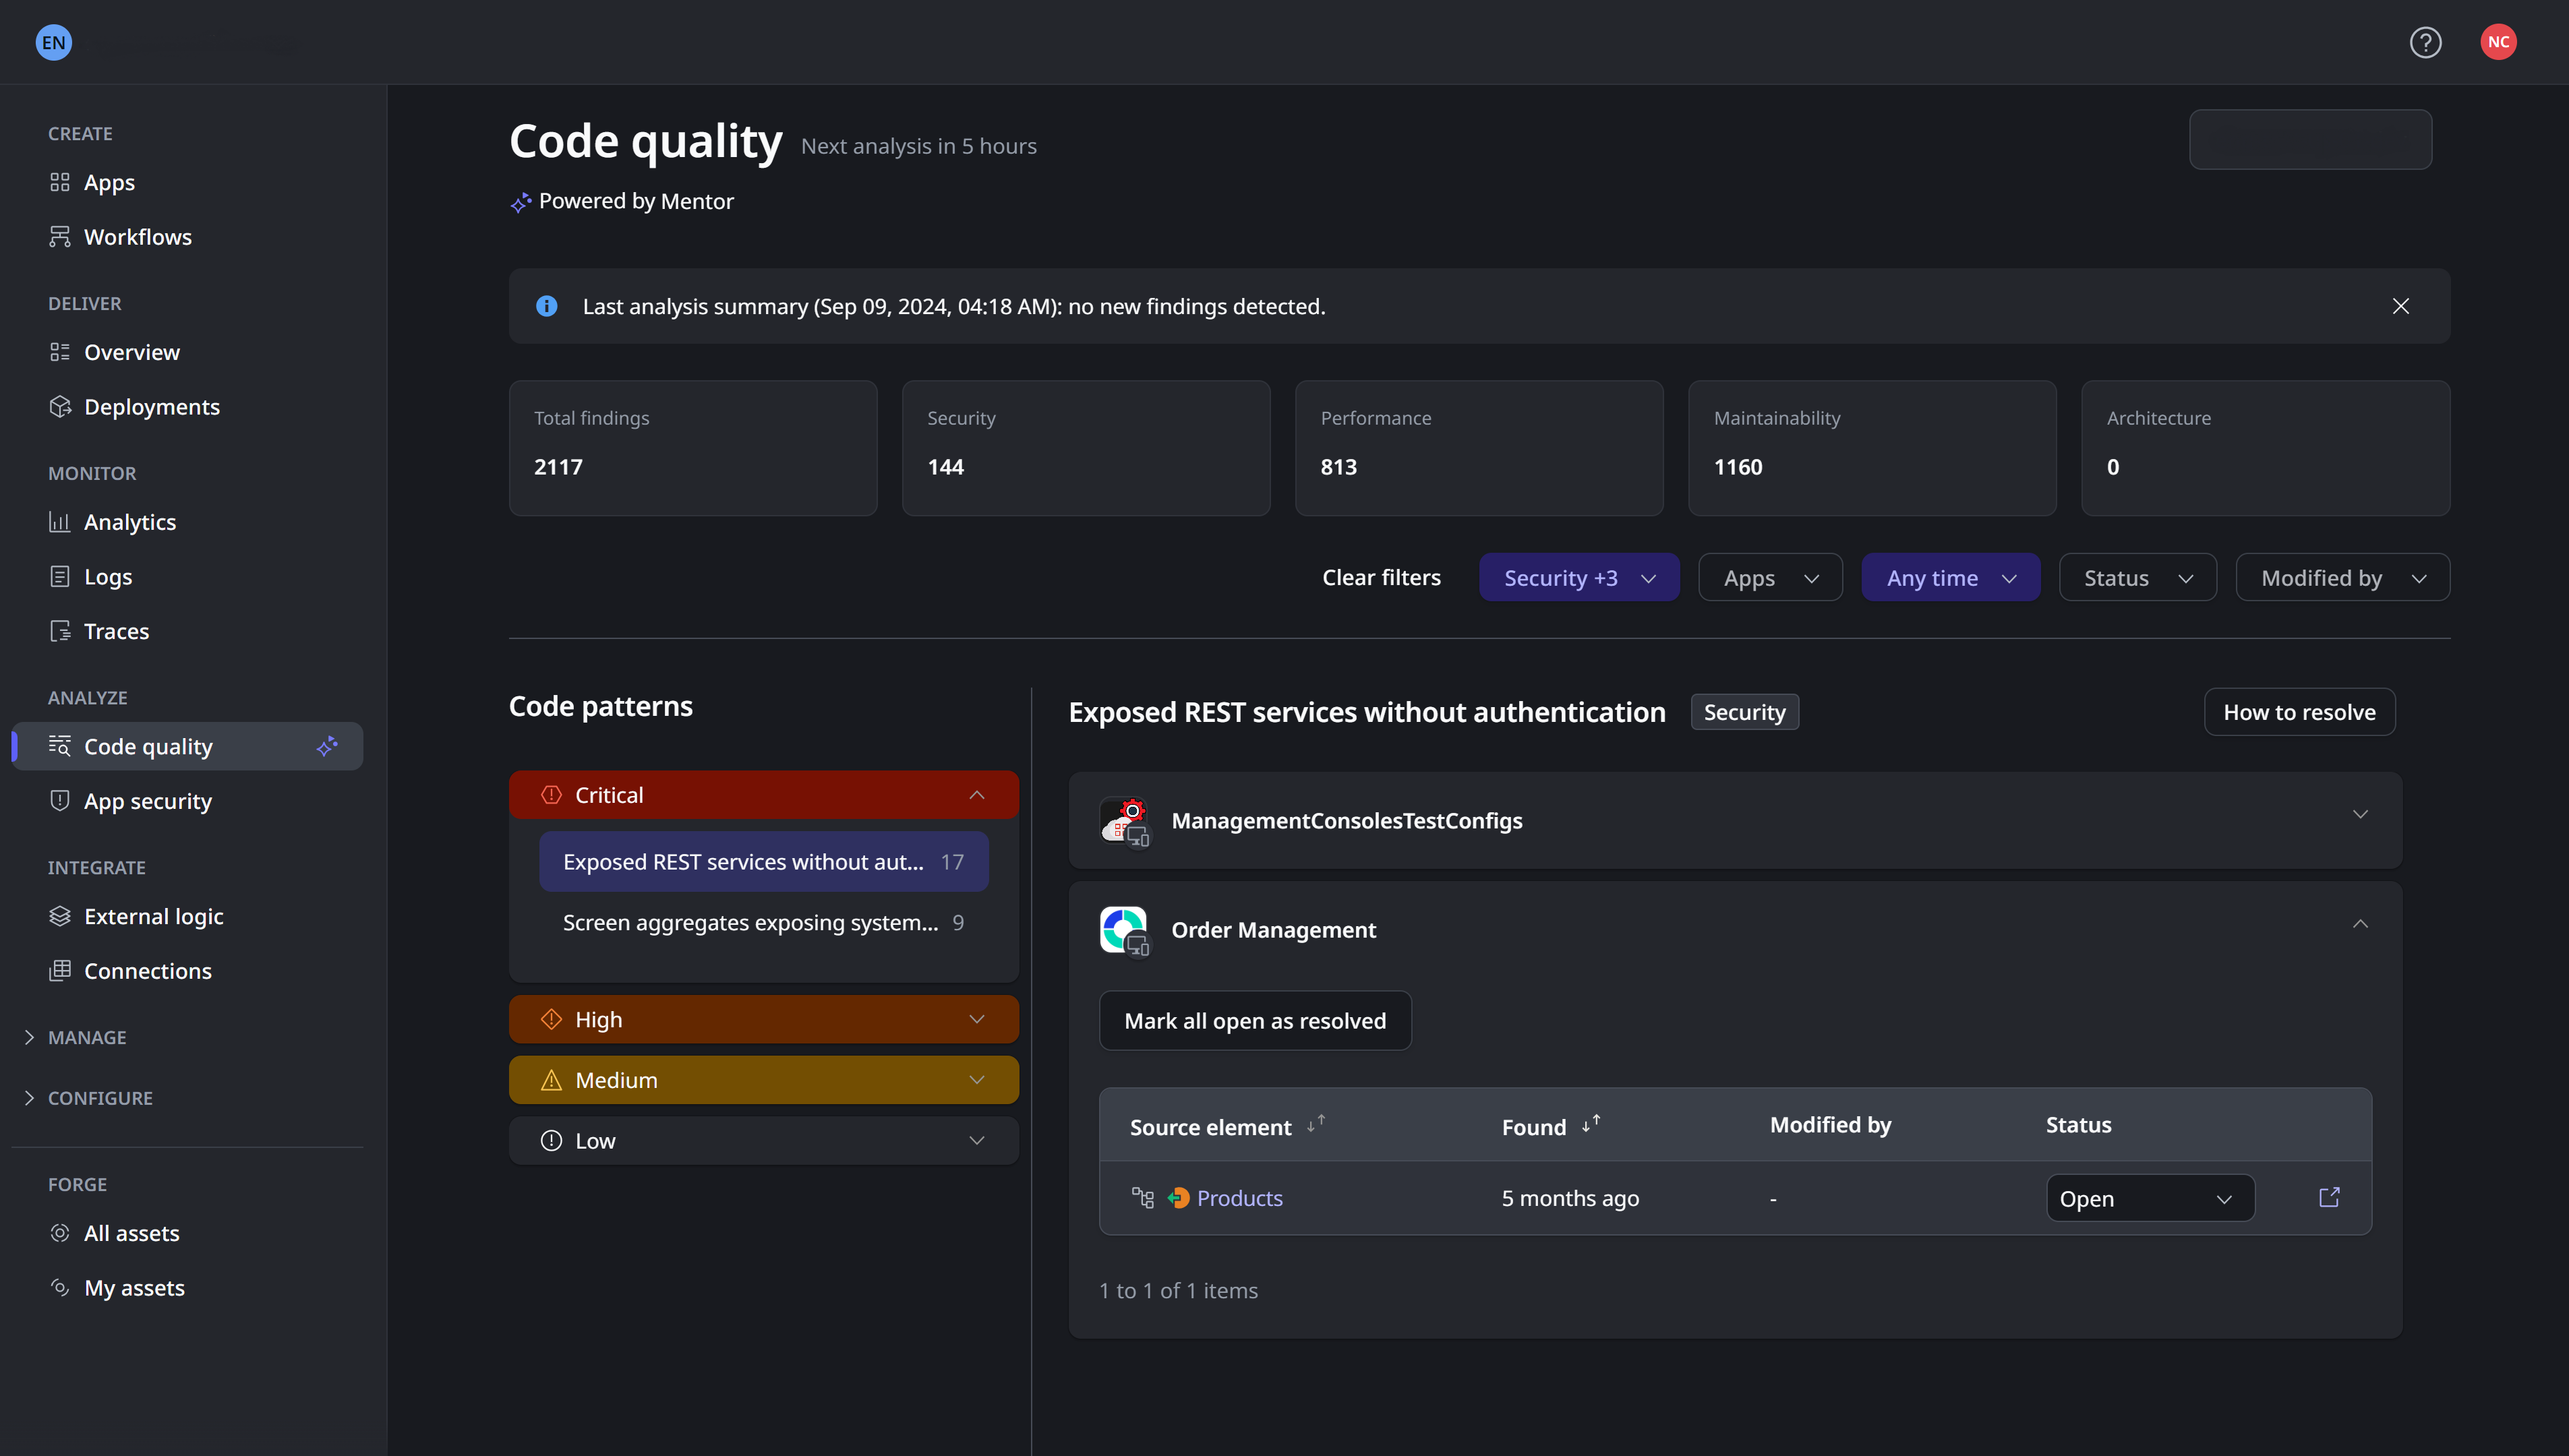
根本原因分析の自動化により、問題を容易に特定し、トラブルシューティングを加速できるため、平均復旧時間(MTTR)が短縮されます。アプリ、エージェント、要素レベルの直感的なドリルダウンビューで詳細なパフォーマンスを確認し、デバッグや推測を行わずにパフォーマンスの問題を迅速に特定できます。
ユーザーデータをエクスペリエンス向上に活用
ユーザーエクスペリエンスに関するデータを利用すると、ユーザーがアプリのパフォーマンスをどのように認識しているかがよくわかります。こうしたインサイトをトラブルシューティングに活用することで、ユーザーニーズに合致した改善を加えられるようになります。クライアント側のトレースとデジタルユーザーエクスペリエンス分析により、ユーザーの期待を上回り、競合他社の優位に立つことができます。
App performance monitoring
FAQ
OutSystems integrates with existing APM tools by streaming open telemetry standard logs, traces and metrics into external monitoring platforms such as New Relic, Splunk, Dynatrace, and AppDynamics. This lets teams keep their current centralized observability stack while monitoring OutSystems applications alongside the rest of their enterprise systems.
Log streaming sends application and platform logs from OutSystems to an external observability or monitoring tool. It helps teams analyze errors, performance events, security activity, and operational behavior in near real time. With log streaming, organizations can centralize monitoring data and investigate issues using their preferred tools.
OutSystems provides out-of-the-box app and agent performance metrics such as response times, request volume, errors, slow queries, and server activity (user activity, drill-down to each app element, app health / Apdex). These metrics help teams identify bottlenecks, troubleshoot issues, and understand how applications behave in production without needing to build custom monitoring from scratch.
Yes. OutSystems supports app and agent monitoring and standard open telemetry standard tracing across client-side and server-side activity, helping teams understand the full path of a user interaction. This end-to-end visibility makes it easier to diagnose slow screens, backend service issues, integration delays, and performance problems that affect the user experience.
OutSystems includes built-in app and agent analytics that help teams understand application and agent usage, adoption, performance, and operational behavior. These analytics tools provide visibility into how software is running and how users interact with them, while also allowing teams to extend reporting through external BI or monitoring systems when needed.
Yes. OutSystems can track application and agent usage, including geographical distribution of users, errors, overall end-user response time, access frequency, and the areas of an app that are most active. This helps teams measure adoption, identify underused functionality, improve user experience, and prioritize future enhancements based on real usage patterns.
Yes. OutSystems supports extracting analytics via open telemetry streaming, and operational data for use in external reporting tools, BI platforms, or custom dashboards. This allows teams to combine application data with other enterprise metrics, create tailored reports, and maintain centralized visibility across business, performance, and user adoption trends.
OutSystems provides APIs and platform services in O11 that allow teams to access performance, usage, and analytics data programmatically. These can support custom dashboards, external reporting, operational workflows, or integration with observability tools. The available approach depends on the data type, deployment model, and reporting requirements.
Analytics data retention depends on the OutSystems environment, configuration, and deployment model. Teams should confirm retention requirements based on their reporting, compliance, and operational needs. For long-term app and agent data analysis, organizations can export or stream relevant metrics into external analytics, BI, or observability platforms.


バックログへの対応
広範なユースケース、テンプレート、強力なパートナーソリューションを活用することで、あらゆるアプリケーションバックログに対応できます。

OutSystemsの評価
世界中の業界アナリストによるローコードプラットフォームの最新調査や、OutSystemsがAI搭載ローコードプラットフォームのリーダーとされている理由をご覧いただけます。

プラットフォームの詳細
ミッションクリティカルなアプリケーションを高速開発できるようになる理由を紹介します。評価ガイドをご覧ください。