Improved Readability of Technical Debt Analysis in Architecture Dashboard
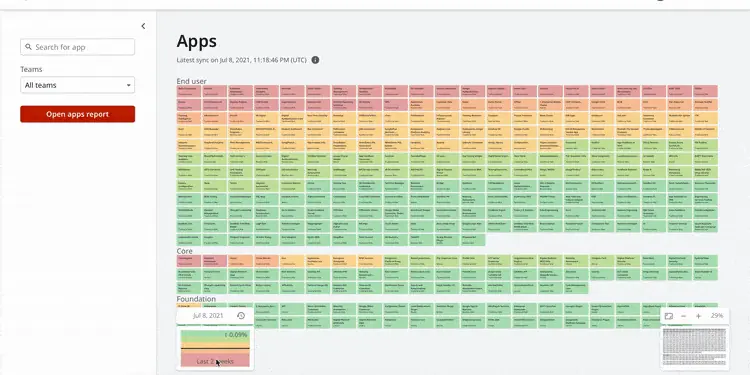
It’s now easier to read the technical debt analysis chart in Architecture Dashboard with our new formula approach. Until recently, our analysis chart showed the distribution of technical debt based on module or application count, and their agility. This chart led to difficulties in reading, since a big application full of technical debt marked as red (for low agility) is represented in the same size as a plugin that would normally be small and green (for high agility). This would end up even more complicated when the trend didn’t match the visual amount of agility. Our new formula approach considers the actual size of a module or app in the factory, delivering an improved perception of your factory's technical debt trend.
Try Architecture Dashboard.- Architecture