Developing with OutSystems
As an OutSystems developer, you've likely faced this problem: a complex screen with aggregates, joins, and filters starts to lag. A server action with an advanced query times out. Your first instinct might be to check the logic, but more often than not, the bottleneck isn't in your ODC logic. It's in the database.
When an advanced query runs slowly, your primary goal is to understand why. Is the database reading millions of rows for a simple lookup? Is it ignoring a helpful index? Is it joining tables in the most inefficient way possible?
You don't have to guess. PostgreSQL provides a powerful diagnostic tool called EXPLAIN. This command is your window into the query optimizer's “mind.” It shows you the exact execution plan the database will use to get your data.
The ODC challenge: You cannot run EXPLAIN directly in an advanced query and get your application data. EXPLAIN returns a query plan (as text), not your entities or structures.
This guide will show you how to copy your existing ODC queries, use EXPLAIN to diagnose them, and identify common performance-killing issues.

What is EXPLAIN? A quick overview
The EXPLAIN command, when prepended to a SELECT, INSERT, UPDATE, or DELETE query, doesn't execute the query (although there is a way to do it). Instead, it returns the execution plan.
The execution plan is a tree of “nodes.” Each node represents an operation the database will perform, such as:
- Scanning a table: Reading rows from disk or memory.
- Using an index: Quickly finding rows using an index.
- Joining tables: Combining rows from two tables (for example, Nested Loop, Hash Join, Merge Join).
- Sorting data: Ordering your results.
- Aggregating data: Performing GROUP BY operations.
For each node, the plan shows cost estimates (the “cost” is an arbitrary unit of computation, not time) and the estimated number of rows.
The best way to use EXPLAIN
There's more to EXPLAIN than just typing it by itself. The best, most practical command adds two parameters:
SQL
    EXPLAIN (ANALYZE, BUFFERS)
- ANALYZE: This is the game-changer. It actually executes the query and returns the real execution times and row counts, not just estimates. This is infinitely more useful.
Important warning
When using ANALYZE with an UPDATE or DELETE query at run time, the query will execute.
To safely analyze these types of queries without modifying data, you must use the “Test SQL” button in design time. When executed this way, all statements are automatically rolled back.
Be cautious! Using ANALYZE on SELECT queries is safe. - BUFFERS: This shows you memory and disk I/O. It tells you how many “blocks” of data were read from the disk (slow) versus found in the cache (fast). High disk reads are a classic bottleneck.
How to use EXPLAIN in ODC
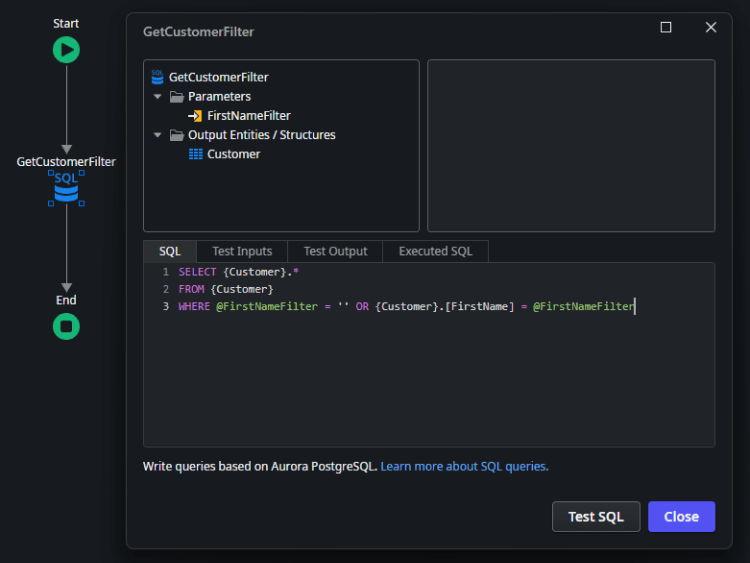
Consider an application with a customer entity containing 10,000 records. For this illustration, we aim to filter customers whose first name is John. We will use the EXPLAIN statement to analyze the execution plan for this straightforward query on the entity.
Identify the query that needs improvement.
To use EXPLAIN, we need to change the query statement. To keep the application working, let’s create a copy of the query node you want to analyze.
To analyze your ODC advanced query, follow these steps:
Change the output structure to a structure that contains only a single text attribute.
- Add the analysis statement: Precede your query with the statement EXPLAIN (ANALYZE, BUFFERS).
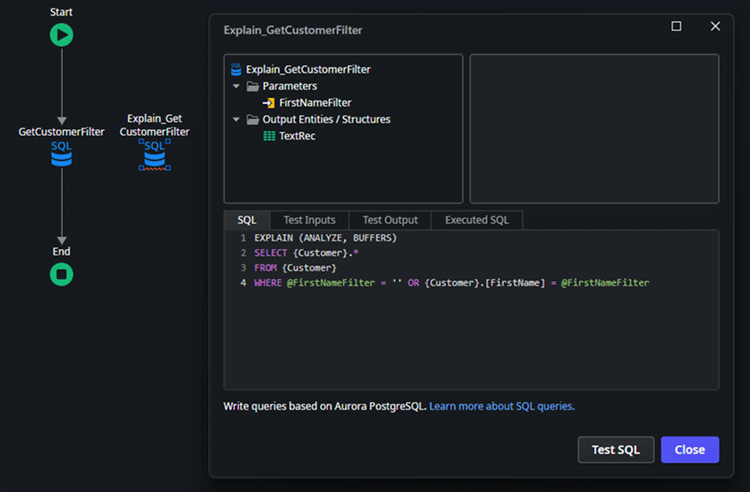
SQL
    EXPLAIN (ANALYZE, BUFFERS)
    SELECT {Customer}.*
    FROM {Customer}
    WHERE @FirstNameFilter = '' OR {Customer}.[FirstName] = @FirstNameFilter
Important note: The query's filters are included in the analysis. For the most relevant results, use filters that accurately represent a real-world execution of the query.
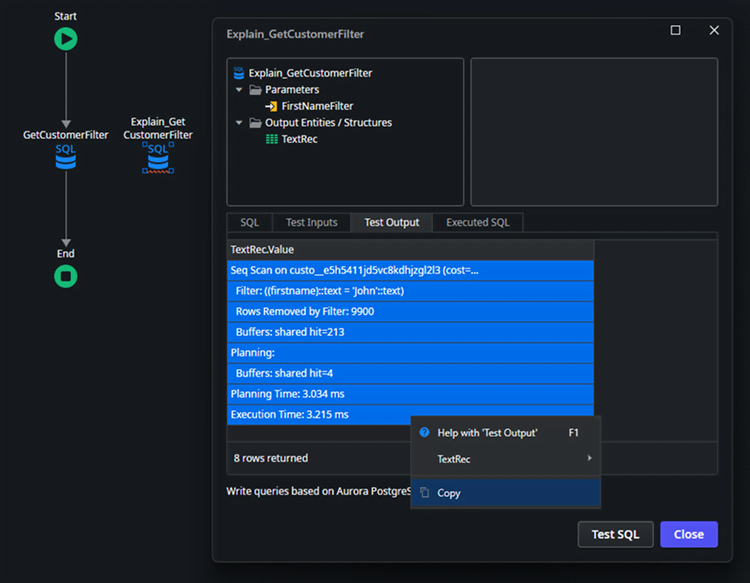
Execute the copied query object. Due to the ODC Studio limitations to show the full result, select all rows and copy the results to a text editor of your choice.
Results:
SQL
    Seq Scan on custo__e5h5411jd5vc8kdhjzgl2l3  (cost=0.00..338.00 rows=100 width=131) (actual time=0.064..3.182 rows=100 loops=1)
        Filter: ((firstname)::text = 'John'::text)
        Rows Removed by Filter: 9900
        Buffers: shared hit=213
    Planning:
        Buffers: shared hit=4
    Planning Time: 3.034 ms
    Execution Time: 3.215 ms
Now that we can see the full result, we need to interpret it. Analyzing the result carefully is paramount to extracting the best hints from EXPLAIN. Let’s go line by line:
- Seq Scan
This is the most important phrase. It confirms the database is reading the table from top to bottom rather than using an index. - custo__…
This is the physical table name that OutSystems generated for your {Customer} entity. The random characters are internal OutSystems identifiers. - rows=100
The query successfully found and returned 100 records. - actual time=...3.182
It took roughly 3.2ms to complete the scan. - Filter: ((firstname)::text = 'John'::text)
This indicates that the filtering happened after the data was read from the disk/memory. The database read a row, checked if it was 'John', and then kept or discarded it. - Rows Removed by Filter: 9900
The “waste” metric is the most telling performance metric. The database physically processed 9,900 rows that it immediately discarded.
The results clearly indicate that an Index is missing for the FirstName filter. Consequently, the query had to examine all 10,000 records, checking the FirstName column in every row against the specified filter value.
TIP: Disable the created copy of the query with the EXPLAIN statement, to be used later.
Let’s create an Index for the column FirstName in the Customer entity and publish the application to apply the Index. Then let's re-run the EXPLAIN query to compare the results.
SQL
    Bitmap Heap Scan on custo__e5h5411jd5vc8kdhjzgl2l3  (cost=5.06..180.46 rows=100 width=131) (actual time=0.049..0.159 rows=100 loops=1)
        Recheck Cond: ((firstname)::text = 'John'::text)
        Heap Blocks: exact=78
        Buffers: shared hit=82
        ->  Bitmap Index Scan on osidx_ulvmgzbjwmc_index1  (cost=0.00..5.04 rows=100 width=0) (actual time=0.032..0.032 rows=100 loops=1)
            Index Cond: ((firstname)::text = 'John'::text)
            Buffers: shared hit=4
    Planning:
        Buffers: shared hit=6
    Planning Time: 0.158 ms
    Execution Time: 0.188 ms
Let’s analyze the new result:
- Bitmap Index Scan
The database went straight to your new index (osidx_ulvmgzbjwmc_index1).
It found the list of locations for all John rows in 0.032 ms. - Bitmap Heap Scan
Using the map created in step 1, it went to the main table (custo__...) and grabbed only the specific blocks containing John. It skipped checking the other 9,900 rows entirely.
Comparing the results:
| Metric | Original run | Improved run | Result |
|---|---|---|---|
| Strategy used | Sequential scan (read everything) | Bitmap index scan (use index) | Smarter access method |
| Total duration | ~31.00 ms (27ms plan + 3ms exec) | ~0.35 ms (0.16ms plan + 0.19ms exec) | ~88x faster (total) |
| Execution time | 3.094 ms | 0.188 ms | 16x faster (raw speed) |
| Memory usage | 213 buffers (pages) | 82 buffers (pages) | 61% less memory/disk I/O |
| Rows filtered | 9,900 rows read and thrown away | 0 rows thrown away | No wasted effort |
This result is the gold standard for this specific query. It confirms that the PostgreSQL optimizer has successfully recognized your new Index (osidx_ulvmgzbjwmc_index1) and determined it is the most efficient path to the data.
Key takeaway for developers
- 3 ms (Seq Scan) might seem fast enough for now.
- But 213 Buffers vs 82 Buffers is the real story.
- As the table grows to 1,000,000 rows, the Seq Scan buffers will grow linearly (to ~21,000 buffers), while the Index Scan buffers will remain very low. That is why we optimize.
Known limitations
The analysis through ODC Studio is limited to the executed stage (Development) in ODC, because it is not possible to open the code and manually run queries in those other stages. However, the EXPLAIN command still runs in other stages besides Development. Extra code would need to be implemented to run such queries in those other stages, and the results would either need to be saved or fetched in runtime to display on a screen.
Using AI to interpret EXPLAIN results
The output from EXPLAIN may be dense and hard to read. This can be a perfect task for an AI. You can copy the entire output and use a prompt to get a human-readable analysis.
Important note: Always review and validate AI-suggested changes to your queries. Do not implement any AI suggestions without verifying they align with your query's objective and analyzing their potential business implications.
Prompt template for developers
Use this prompt to help you analyze your query plan:
Prompt:
Act as a Senior PostgreSQL Database Administrator (DBA) specializing in query performance tuning. I am an application developer and not a database expert.
My application is running the following SQL query:
None
    [PASTE YOUR ORIGINAL SQL QUERY HERE]
This query is slow. I ran EXPLAIN (ANALYZE, BUFFERS) and got the following query plan:
None
    [PASTE THE *ENTIRE* EXPLAIN OUTPUT HERE]
Please analyze this execution plan and provide the following:
- Executive summary: In simple terms, what is the main performance bottleneck?
- Detailed analysis: Go through the plan node by node and explain what the “bad” parts mean (for example, “Seq Scan,” “Nested Loop,” “Disk Sort”").
- Specific recommendations: What is the single most important thing I can do to fix this? (for example, “Create a specific index,” “Rewrite the JOIN”).
AI response
None
    Executive Summary (main bottleneck)
    Your query is slow because PostgreSQL is doing a sequential scan (reading the whole table) and then filtering rows. In your plan it read 10,000 rows, kept 100, and discarded 9,900. That happens because the OR pattern (@FirstNameFilter = '' OR FirstName = @FirstNameFilter) commonly prevents PostgreSQL from using an index efficiently, so it falls back to “scan everything”.

    -

    Detailed Analysis (node by node, what the “bad” parts mean)
    1) Seq Scan on custo__...
    Meaning: PostgreSQL is scanning the table from start to finish.
    Why it’s “bad”: It scales linearly with table size. 10k rows is small, but if this table grows (100k, 1M…), the same pattern becomes very slow.


    In your plan:


    actual time=0.064..3.182 rows=100 → total time was ~3.2 ms on this small dataset. The pattern is the issue; the table size is currently masking it.


    2) Filter: ((firstname)::text = 'John'::text)
    Meaning: After reading each row, it checks if firstname = 'John'.
    Why it’s “bad”: Filtering after reading everything means you pay the cost of reading rows you don’t need. An index would allow PostgreSQL to jump directly to 'John' rows.


    3) Rows Removed by Filter: 9900
    Meaning: It read 10,000 rows, threw away 9,900.
    Why it’s “bad”: This is the clearest “wasted work” metric in your plan.


    4) Buffers: shared hit=213
    Meaning: The data came from memory cache (“hit”), not disk.
    Why it matters: You’re already in a best-case scenario (cached pages). If the table isn’t cached (or is much larger), it gets worse because scanning hits disk.


    5) Planning section
    Planning Time: 3.034 ms is relatively high compared to execution time here, but that’s not your core issue. The core issue is still “scan everything”.


    -


    Specific Recommendations (single most important fix)
    ✅ The #1 fix: Rewrite the query to avoid the OR
    Instead of:
    WHERE @FirstNameFilter = '' OR Customer.FirstName = @FirstNameFilter

    Use two different SQL statements depending on whether the filter is empty:
    If filter is provided:


    SELECT *
    FROM Customer
    WHERE FirstName = $1;

    If filter is empty:


    SELECT *
    FROM Customer;

    Why this is the most important:
     This lets PostgreSQL produce a plan that can use an index when filtering, instead of being forced into a generic “OR” plan that often results in a sequential scan.

    -

    What to do next (practical, still simple)
    1) Create an index for the filtered case
    If you expect this filter to be used often:
    CREATE INDEX CONCURRENTLY idx_customer_firstname ON Customer (FirstName);

    CONCURRENTLY avoids blocking writes (good for production).


    After creating it, run ANALYZE Customer; (or wait for autovacuum) so the planner has fresh stats.


    2) Verify with EXPLAIN
    When FirstNameFilter = 'John', you want to see something like:
    Index Scan or Bitmap Index Scan on idx_customer_firstname


    -


    Why the current query structure triggers the seq scan
    That @FirstNameFilter = '' OR ... pattern is a classic “optional parameter” trick from app code, but it often causes PostgreSQL to choose a plan that works “okay” for both cases (filter empty and filter set). The “one-size-fits-all” plan is frequently a sequential scan.

    -

    If you paste the table size (\dt+ / approximate row count) and whether FirstName is text/varchar/citext, I can tell you whether you should expect an Index Scan vs a Bitmap plan and what selectivity threshold applies.
Conclusion
Performance tuning is a process of measuring, not guessing. EXPLAIN is your primary measurement tool. By integrating it into your development workflow, you can move from “this query is slow” to “this query is slow because it's doing a Seq Scan on the table, and I can fix it by adding an index on the column.”
Next steps
- Check out the PostgreSQL Explain official documentation.
- Check out the ODC Data Management Best Practices documentation.
Stop guessing and start explaining!