Building a Rocket Launch App with Tableau Javascript API & OutSystems
In this blog post, I’ll show you how to use the Tableau JavaScript API to integrate Tableau visualizations into your OutSystems Web applications.
Here are the tools you'll need:
Rocket Launch App
SpaceX made history on May 30, 2020, launching NASA astronauts Bob Behnken and Doug Hurley to space aboard its Crew Dragon spacecraft using a Falcon 9 rocket. This is the first time ever that mankind has been aboard a private spacecraft vehicle that has ever delivered human astronauts to space.
Now you may have been there to see history, or you completely forgot the broadcast and you missed it. If your FOMO has peaked a new interest in this new era of democratizing access to space, you now have the ability to explore like never before. Starting today, you can build an absolutely nonsensical space launch app in minutes. You can launch your imagination and personal spacecraft into space, without interruptions. While weather may thwart Space X's first launch attempt, you know better to double-check your data before you make an executive decision. One of the best ways to visualize and understand data is through Tableau.
Tableau is a visualization platform that unleash the power of your data assets to make informed decisions.
Step 1: Tableau JS API
This Javascript API will visualize Storm Tracking data pulled from NOAA. In our Rocket Launch application, we will be able to track storm data and decide if you are safe to launch or must abort your out-of-this-world mission.
Step 2: Building the Library
For all you data-nuts out there, we'll get started with some good practices for reusability by creating your TableauJS API library. This reusability will help you easily launch your build, as well as launch other demos. Especially if you're thinking of creating a Gardening Demo app once you land on Mars.
This library will be a collection of functions which can be added to our application. More precisely any object, not only functions will be stored in our library.
In this library we will need to require the script to call for Tableau's public servers. Check for the latest Tableau Server Version for Javascript API Versions. In our library, we will create and call on a function that will pull from these servers to embed a visualization in a div element. Note that our input parameters will pull from Tableau's external data source.
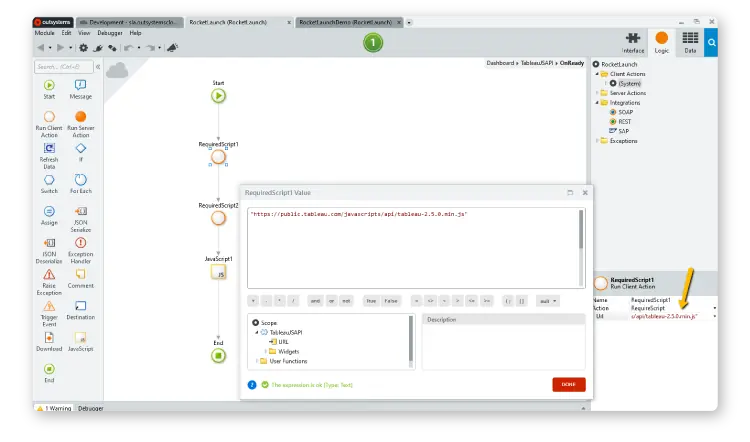
In your RequireScript client action, embed:
In your RequireScript client action, embed this code.
Otherwise, check your latest Tableau Server Version for JavaScript API Versions.
Repeat for your second RequireScript.
Step 3: Embedding a Visualization
Starting from Function, copy and paste the function from Tableau JavaScript API Help.
Back in our TableauJSAPI block, ensure you create a WidgetId and URL Input Parameter where we will drag and drop a JS Script widget noto the Action Flow.
Replace “vizContainer” on line 2 by clicking on “WidgetId” Input Parameter to get $parameters.WidgetId.
Replace server "http://public.tableau.com/views/RegionalSampleWorkbook/Storms" by clicking on URL Input Parameter to get “$parameters.URL
Go to the very in and remember to call the function by including: initViz();

Result:
function initViz() {
            var containerDiv = document.getElementById($parameters.WidgetId),
                url = $parameters.URL,
                options = {
                    hideTabs: true,
                    onFirstInteractive: function () {
                        console.log("Run this code when the viz has finished loading.");
                    }
                };
            var viz = new tableau.Viz(containerDiv, url, options);
            // Create a viz object and embed it in the container div.
        }
initViz();
Once we create a div container in our library, we will be able to use this for our front-end build.
A huge reminder here is creating your div containers after your JS script is inserted. I was stuck on this part and could not get the API visualization to show on the front-end of my application.
In your Interface tab, create a (TableauDiv) Div Container in the TableauJSAPI widget. Create a placeholder for the True branch and create a "TableauDiv" container in the False branch. This True/False branch strategy will help remind the developer with a visual placeholder. This will also accurately visualize your third-party component after the Screen is ready, and before the transition starts.

Step 4: Build Reactive Web Applications
Back in your OutSystems development environment, we'll create a module to build a Reactive Web App to showcase your NOAA weather data and build your Launch or Abort command center.
As your library is foreign to Service Studio, manage your dependencies to reference your API. Drop your TableauJSAPI block into the main screen we’ve created.
Copy and paste the public server URL Tableau shared on their site, into your TableauJSAPI block:
"https://public.tableau.com/views/RegionalSampleWorkbook/Storms"
Step 5: Design
In your MainFlow, create a Launch screen and Abort screen for your pseudo launch options. When your buttons direct you to a Launch Success page or Abort Launch page, include a gif to see the results of your decision.
Step 6: Launch
Launch your app, view your NOAA data and try out your totally real SpaceX launcher. Once you’ve published your application, you will be able to use it on your demo server. You will see Tableau JS API dynamically load and resize weather data visualizations. Considering weather decisions, you as the Mission Control center can decide if the weather is advising for or against a spacecraft launch.
Use OutSystems Now!
Get your first app built in a few minutes.
It's free forever.
Resources
Here is the Forge Component.
You can also watch the full tutorial in the video Build a Parody Rocket Launch App with Tableau Javascript API and OutSystems.