Troubleshooting Android: The Ultimate Toolset You Need
As developers, we know that app issues are almost a sure thing to happen, and it is not unusual to have a problem that its origin is hard to pinpoint, and therefore it is hard to solve. Without the right troubleshooting tools, we might slow down the fixing process or even create new problems. That’s why having a toolset that helps you locate the source of the problem and solve it is key. In this blog post, I’ll share the ultimate toolset you need to troubleshoot and debug Android apps built with OutSystems.
What about iOS, you ask? Apple has different requirements, so the process is a bit different. To learn more about it, I invite you to read David Martins’s article, How to Troubleshoot iOS on Windows.
For you all Android developers, the good news is you don’t need a vast arsenal. Let’s get started!
4 Tools for Android Troubleshooting
If you’re an OutSystems developer, like me, I’m sure you know that the platform has great built-in debug features to troubleshoot your apps. But for more advanced scenarios, I find it helpful to use other tools to go that extra mile. Plus, you can also use them for troubleshooting and debugging apps built in any technology as long as they’re Android.
So, if you’re a mobile developer, I hope you find the next section useful.
Chrome Toolkit
Most of you already know this, but it is never too much to mention the capabilities of Google Chrome while developing web or mobile applications. For OutSystems developers, because OutSystems mobile applications are based on Javascript, HTML, and CSS, you can test the applications using the browser. However, the Chrome toolkit only works when there is no need for plugins that access the native resources or sensors of your mobile device.
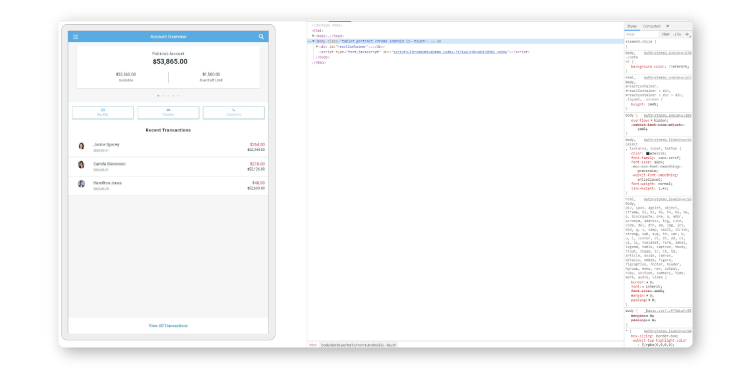
That being said, Chrome provides us with the toolkit by pressing F12 or by selecting the inspect option in the right-click menu in your browser-application. Chrome Toolkit enables you to see the HTML hierarchy, local storage, network consumption, and others as shown in the image below.

This is a valuable tool that helps a lot during development and troubleshooting.
Chrome Debugger on Device
Did you know that Chrome also provides a way to debug an application or website in a real device?
Here you can see what you need to do to start using it. This is very helpful when you have problems that only occur in real devices and not while testing in the desktop browser.
The image below is an example of a demo application that it’s connected to Chrome. And this is how it looks like while debugging it in Chrome:
By using Chrome Remote Debugging, you can do everything you do when inspecting an element of a web application.
Android Studio and Logcat
If you’re dealing with advanced scenarios, Android Studio and Logcat are a better solution over Chrome. They are also the primary tool used by Android app developers. It can be very useful when dealing with weird crashes and issues from an unknown origin.
As I said above, because OutSystems mobile apps are based on Javascript, HTML, and CSS, you can’t debug the whole app within Android Studio (I am using version 3.6.1), but you can use it to see all the logs and exceptions that are thrown from the native code of the app.
To access the logs and exceptions, you only need to connect the Android device via USB and the ADB (Android Debug Bridge) to your laptop. And use the following path:
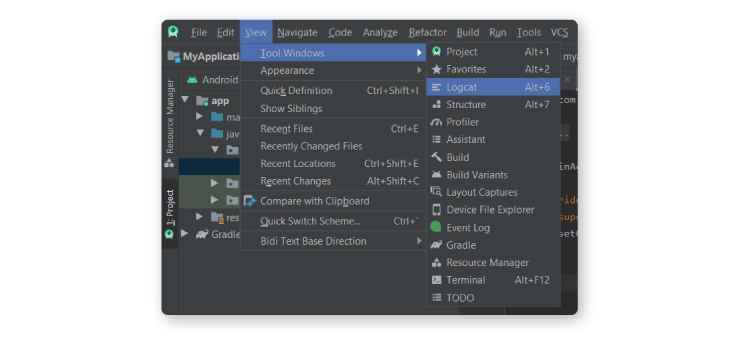
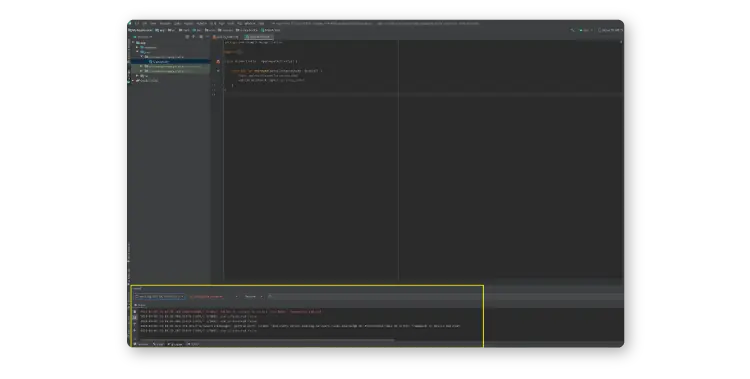
As soon as you enable it, the Logcat window will appear at the bottom of the screen:
Android Virtual Device
If you don’t have the Android device with the specific screen size or Android version that you need to debug, you can use AVD to create, well, a virtual version of that device and debug the app on an Android device. And you can also use it to debug OutSystems apps. OutSystems MVP Armando Gomes has an in-depth tutorial on how to debug OutSystems mobile apps using AVD, that I invite you to take a look at if you want to learn more.
Wrapping Up
I won’t say these tools will bring some fun into debugging because there’s no such thing, but hopefully, they’ll make it a little less painful.
If you want more tips and tricks about how to debug Android, here are some useful links from OutSystems documentation:
Now, go troubleshoot and debug those Android apps!
Use OutSystems Now!
Get your first app built in a few minutes.
It's free forever.