As a previous lifetime working as a developer, I was constantly asked to make rockstar graphs to show off data by my bosses. This request always comes up and what better can you do than show off the data and impress them by presenting it with cool graphics, tooltips, animations, and colors. This article will help you build advanced HighCharts in the OutSystems low-code platform.

Table of contents:
For this article, I’ll assume you have already created a free Personal Environment following these simple instructions from my great co-worker Otávio, Medium Article by OutSystems or are running on a purchased OutSystems license. (If not, you can get started in just a few minutes by signing up to our Free Edition -- yep, it’s forever free).
If you are unfamiliar with HighCharts, check out their chart demo page here and be amazed by their top of the line graphs of all types! Did you know that under the hood, all charts that come with Service Studio are using HighCharts.js? Directly in Service Studio, you can add many chart types like area, bar, column, donut, line and pic! We even offer a widget to add a tooltip.
Secondly, we also offer the OutSystems Forge which has reusable components where more charts can be added quite easily. However, if you are adamant on adding a specific chart you’ve found in a JavaScript library online, you should know that it isn’t too complicated to make it happen.
This third option, exploring adding JavaScript libraries directly to Service Studio, is what we will do in this demo.
Building an Advanced HighChart: Step-by-Step Demo
Let’s get started:
- 1. Download the HighCharts 10.2.1 library here; just click the purple button at the bottom of the page.
- 2. Open up the downloaded folder, expand the ‘examples’ folder, then open a folder and double click the html file inside to view it in the browser.
- 3. If the graph meets what you are looking for, right click in the browser and select ‘View page source’ or view the html in VS Code or another code editor. For this HighChart example, we will use the ‘network-graph’ folder as seen below.
You can hover over each bubble and it will become highlighted while the others fade to the background. Tooltips appear with the name of the language when you examine a bubble. Additionally, when it loads, it creates a cool animation. You may be tempted to reload the page just to watch the animation happen again.
- 4. Scroll down past the CSS and you should see script tags importing HighChart.js files. Navigate back to the downloaded HighChart folder, and locate each of these files. Within Service Studio, you will import these scripts by right clicking on ‘Scripts’ within the ‘Interface’ tab as shown below:

Import Script
- 5. On the screen of where you would like to display your graph, you will need to add each required script displayed in the html file so that they will all load when the screen is loaded. You should see this option to add when you click once on the screen then scroll down in the properties as shown below:

Next let’s create the container where the chart will show up.
- 6. All you do is drag and drop a container element onto the screen. Then in the name property, call it ‘ChartContainer.’ This will later be referenced to in our javascript.
- 7. You will also need the CSS located at the top of the html file and before the HighChart script tags. Within the ChartContainer, open the CSS editor by clicking inside ‘Style Classes’ as shown below:

Within the CSS editor paste all the CSS from the network-graph index.html file.
- 8. Navigate back to the screen properties. Here you need to add an OnRender client action.This action will load the script at the same time the page is loading the rest of the visual elements. If the page reloads, the OnRender function will run again causing this graph to update with the latest data if it is populating its data from an API. To review all of the lifecycle handlers, check out the documentation here. The OnRender will have the custom javascript that creates your line graph. You will need to drag and drop the javascript widget into the OnRender client action as shown in two steps below:

- 9. Once complete, go to the html and locate the javascript. It should begin on line 74 if you selected ‘View Page Source’ after opening it in the browser. Begin copying from line 74 to 277 and paste this code into the javascript widget inside Service Studio. Line 47, that starts with ‘Highcharts.chart(‘container,’ will need to be edited for it to work.
- 10. Because the id or name field in terms of the OutSystems Service Studio is labeled ‘ChartContainer’, the javascript will need to reference it on line 47 of the JS editor. To demonstrate how we can pass data to the JS script, we are going to pass this ChartContainer as a parameter. To do this, just right click on parameters inside the JS editor and select ‘Input Parameter.’ For the name field type ‘ContainerId’, IsMandatory field select ‘Yes’ and for the data type select ‘Text.’ In line 47, reference the parameter the following way ‘Highcharts.chart($parameters.ContainerId, {.’ Your JS editor should look like the image below:

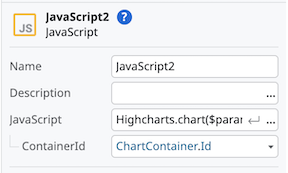
- 11. After pressing done, the last tie to make the graph appear will be to set the input parameter, ContainerId, to ChartContainer.Id on the JS script like below:
- 12. After clicking ‘One Click Publish’, you should see your new network graph!
The best way to integrate dynamic code from API’s or aggregate data is to expand on the usage of the parameters tool like we did for the container id. Just store the data from the API as a variable, and reference it in the script by adding parameters.
And That's It!
Congrats on creating your first HighCharts network graph using OutSystems. The rest of the graphs are done exactly the same way. Feel free to share with me on Twitter or via OutSystems Community what you have created, any problems that came up along the way, and what you would like to learn more about! Have fun!